CISO Readability Review — UI Screenshots vs Product Spec
Date: 2026-03-03
Trigger: Local Docker build of sv0-platform (v0.2-dev) with seed data, automated QA (visual-qa + ux-audit), correlated against Notion-synced product specs.
Status: Research complete — actionable gaps identified.
Test environment: Docker Compose (mongo 7.0, api, ui on :8080), tenant demo-w1 (105 entities, 10 workloads, 6 risk clusters).
QA results: 11/11 pages PASS (visual), 10/10 flows PASS (UX audit), 0 issues.
Seed data caveat: This review used
demo-w1seed data (51 findings, 105 entities, 10 workloads). Production environments will likely have larger datasets, which would amplify the readability issues described — particularly on table-heavy pages like Findings and Entities.
Executive Summary
The v0.2 UI is functionally solid — all pages render, navigation works, data flows correctly, accessibility passes. The design system is consistent and the progressive disclosure pattern (Overview → Cluster → Paths → Detail) is well-executed.
However, the UI currently serves analysts better than CISOs. The product specs (Clarity UX spec, UX feedback docs, Authority Path concept review) define a clear CISO-first mental model that is only partially implemented. The biggest gaps are missing verdict sentences, missing evidence grades, and title framing that uses platform jargon instead of execution-determined language.
Method
- Built sv0-platform locally via
docker compose up --build - Seeded
demo-w1tenant (10 workloads, W1.1 full dataset) - Ran
scripts/visual-qa.ts(Playwright, 11 pages, headless Chromium) - Ran
scripts/ux-audit.ts(Playwright, 8 audit sections, 10 flows) - Captured 26 screenshots across both suites
- Correlated each screenshot against Notion-synced product specs (4 UX feedback docs) and 3 existing product reviews (listed in
relatedfield above)
CISO Readability Spectrum
| Page | CISO-Readable | Primary Audience | Screenshot |
|---|---|---|---|
| Overview / Dashboard | Partially | CISO + Analyst | screenshot |
| Data Domains | Yes | CISO | screenshot |
| Identities | Yes | CISO + Analyst | screenshot |
| Execution Chains | Partially | Analyst | screenshot |
| Exposures | Partially | Analyst | screenshot |
| Authority Path Detail | Partially | Analyst (best for CISO demos) | screenshot |
| Cluster Detail | Partially | Analyst | screenshot |
| Findings | No | Analyst | screenshot |
| Entities | No | Analyst | screenshot |
| Graph Explorer | No | Analyst | screenshot |
| Settings / Syncs / Temporal | N/A | Operator | — |
Page-by-Page Analysis
Overview Dashboard
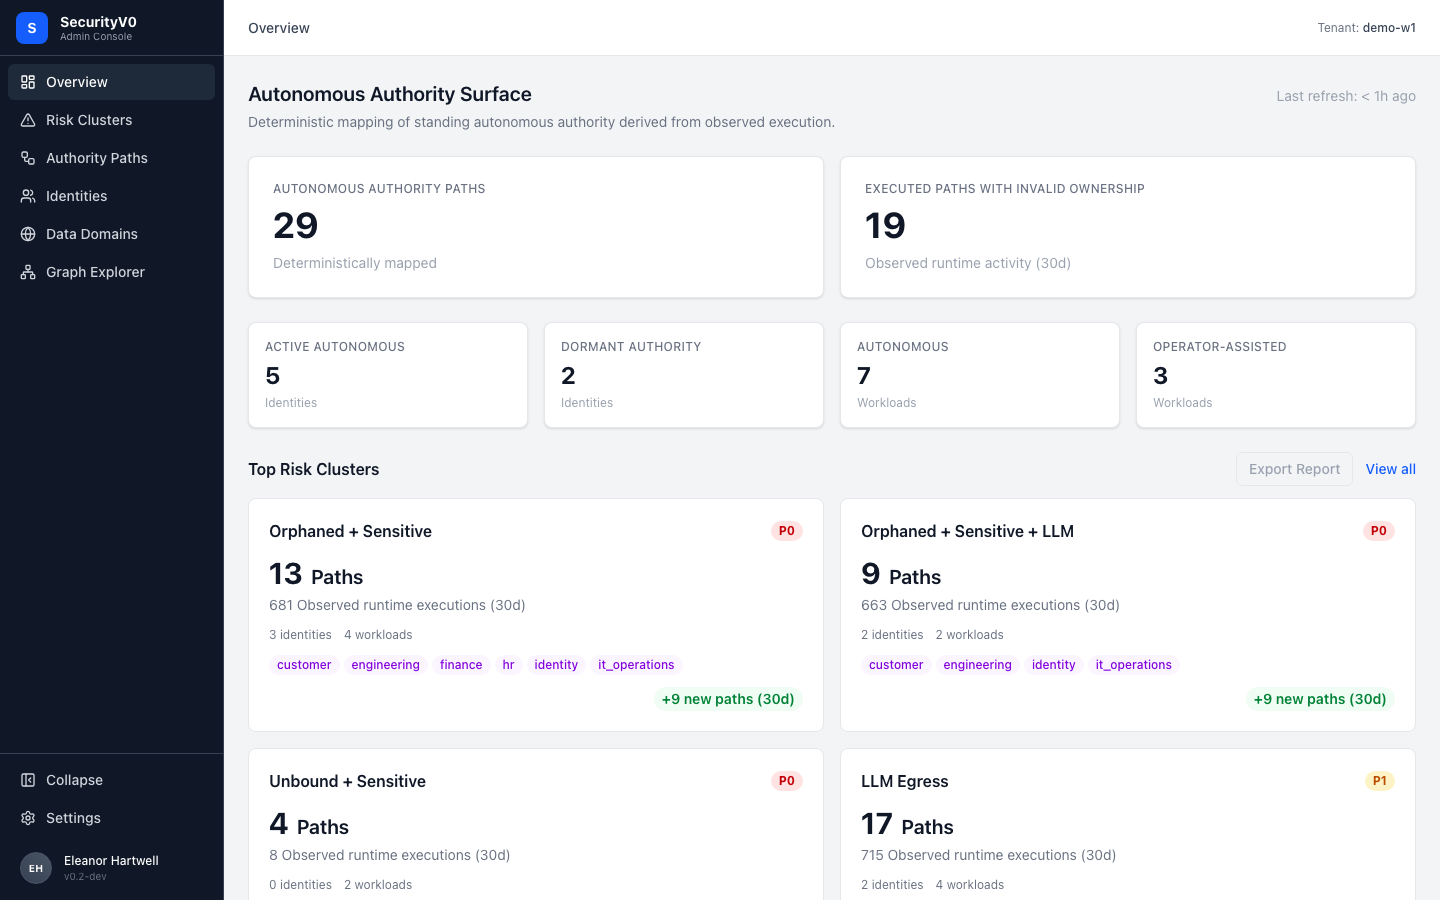
What renders: Title "Autonomous Authority Surface", two hero tiles (29 Authority Paths, 19 Executed Paths with Invalid Ownership), four stat cards (Active Autonomous 5, Dormant Authority 2, Autonomous Workloads 7, Operator-Assisted 3), Top Risk Clusters section with cards (Orphaned + Sensitive P0, Orphaned + Sensitive + LLM P0, Unbound + Sensitive P0, LLM Egress P1).
| Spec Requirement | Current UI | Status |
|---|---|---|
| Title: "Observed Autonomous Execution (30d)" | "Autonomous Authority Surface" | Gap — too abstract |
| Hero tile 1: Total executions (big number) + delta | Shows path count (29) not execution count | Gap — wrong metric promoted |
| Top risk clusters with verdict sentence | Cards show path counts + domain tags, no verdict | Gap — missing verdict sentence |
| Functional cluster names | Uses attribute-style names ("Orphaned + Sensitive") | Gap — spec says use functional names |
| P0/P1 priority badges | Present | Aligned |
| "+N new paths (30d)" trend | Present on cluster cards | Aligned |
Gap detail — verdict sentences: The Clarity spec prescribes each cluster card should include a sentence like:
"13 autonomous paths exercised Finance/HR/Customer-scoped authority and invoked external endpoints 681 times in the last 30 days — all under orphaned ownership."
Current: Just "13 Paths / 681 Observed runtime executions (30d) / 3 identities / 4 workloads."
The data to compose verdict sentences is already present on each card — this is a rendering change, not a data change.
Cluster Detail (Authority Paths filtered by cluster)
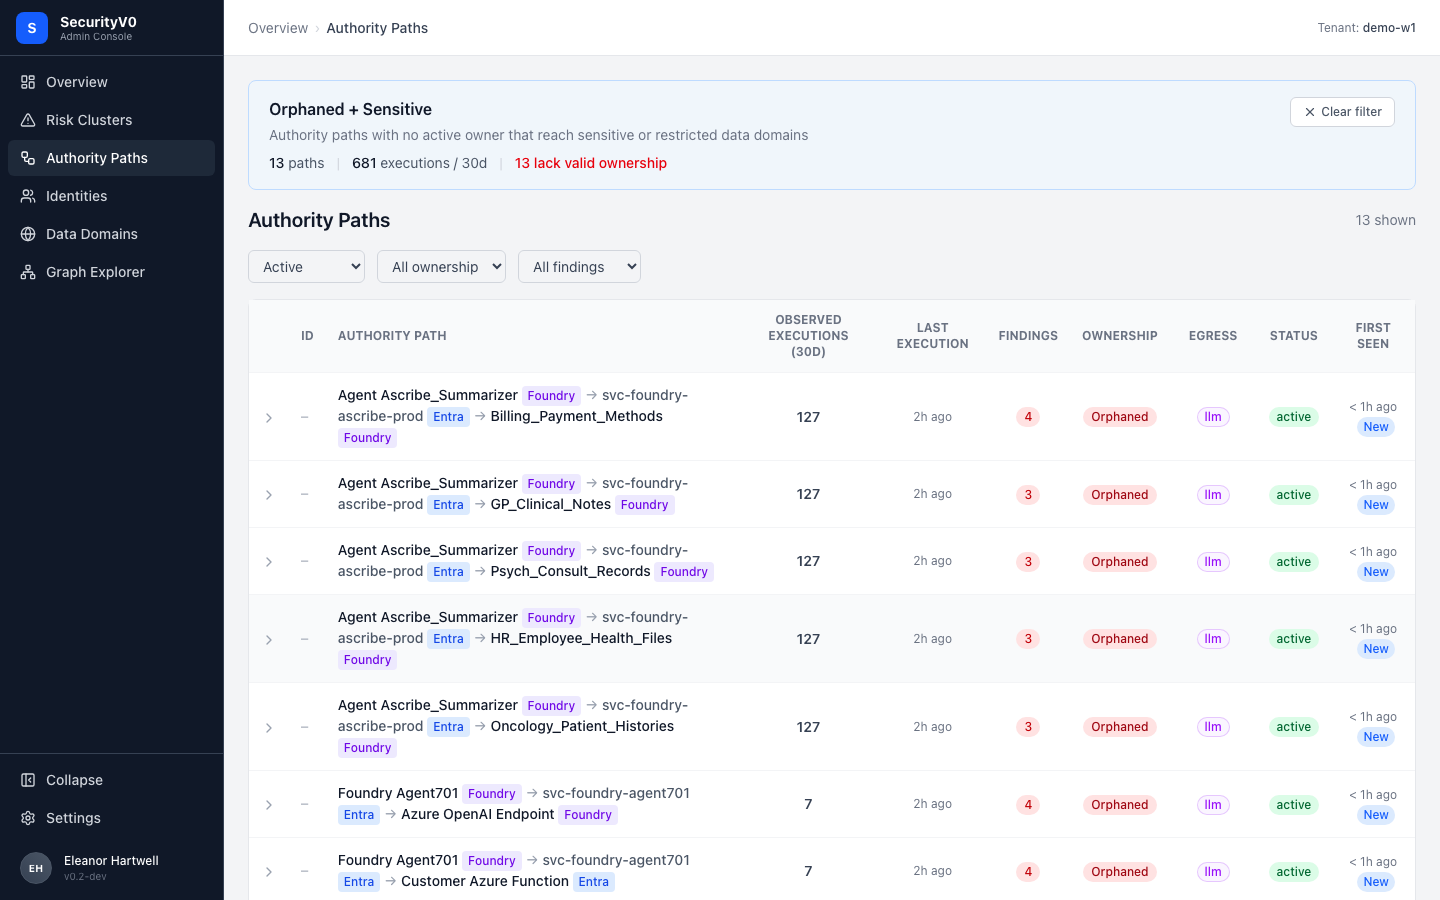
What renders: Blue contextual banner explaining the cluster ("Authority paths with no active owner that reach sensitive or restricted data domains"), summary stats (13 paths, 681 executions/30d, 13 lack valid ownership), table of authority paths with 9 columns.
| Spec Requirement | Current UI | Status |
|---|---|---|
| Contextual cluster banner | Present — plain English explanation | Aligned |
| "N lack valid ownership" in red | Present | Aligned |
| Authority path table columns | All 9 present (ID, Path, Executions, Last Exec, Findings, Ownership, Egress, Status, First Seen) | Aligned |
| Bold name and execution count columns | Regular weight | Gap — should be bold per spec |
| Evidence grade indicator (A/B/C) | Not present | Gap |
The banner at the top of this page is the best CISO-facing element in the entire UI — it translates technical state into a risk statement. This pattern should be replicated on other pages.
Authority Path Row Expanded
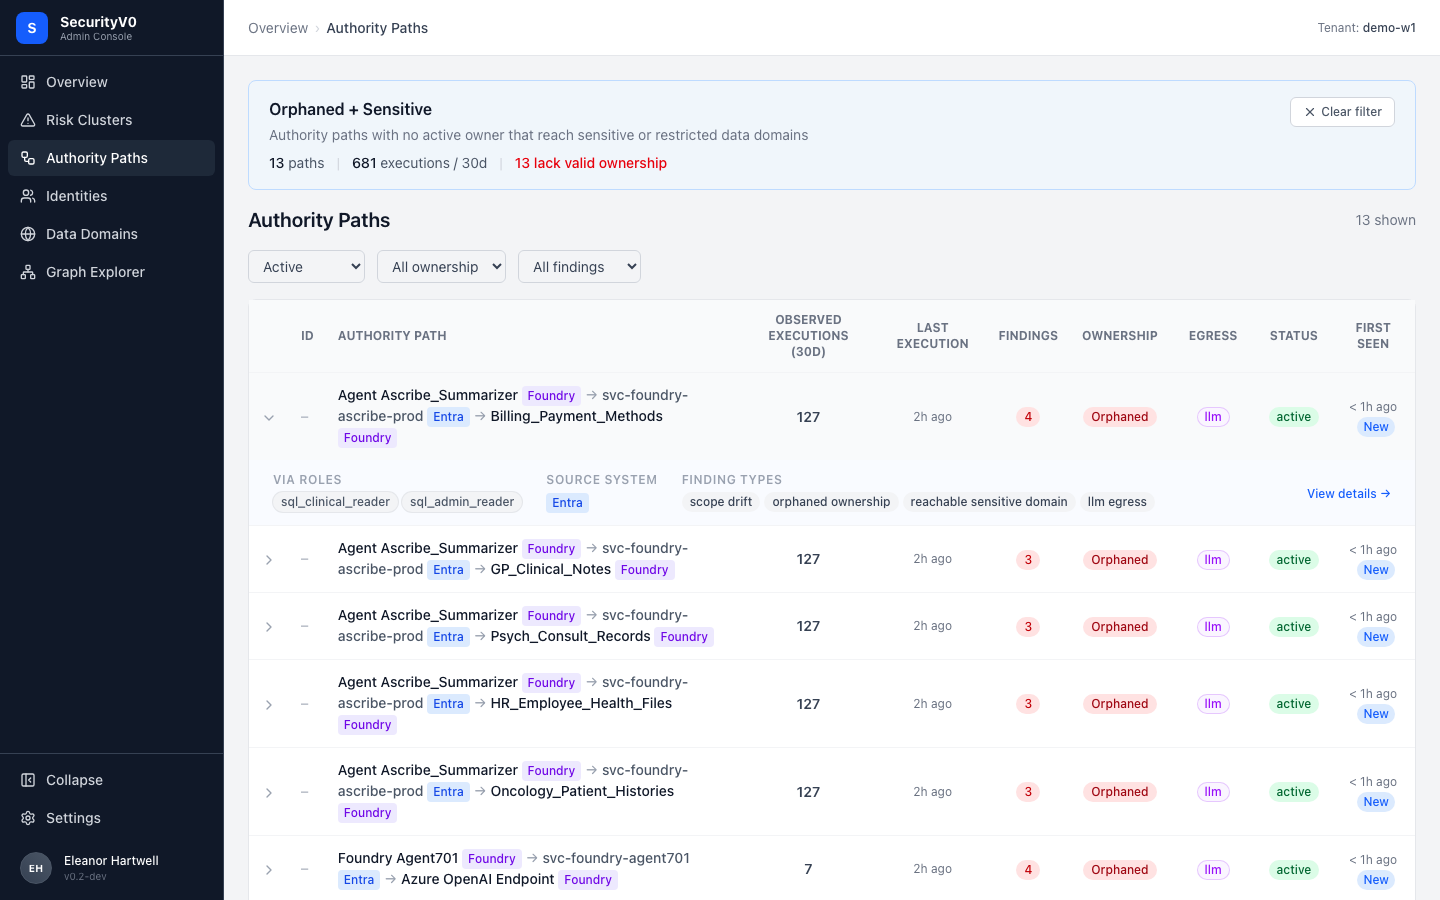
What renders: Inline expansion showing VIA ROLES (sql_clinical_reader, sql_admin_reader), SOURCE SYSTEM (Entra), FINDING TYPES (scope drift, orphaned ownership, reachable sensitive domain, llm egress) as chips. "View details" link.
This is correctly scoped as analyst drill-down. Progressive disclosure pattern works well — expand without leaving the page, then navigate to full detail via "View details."
Authority Path Detail
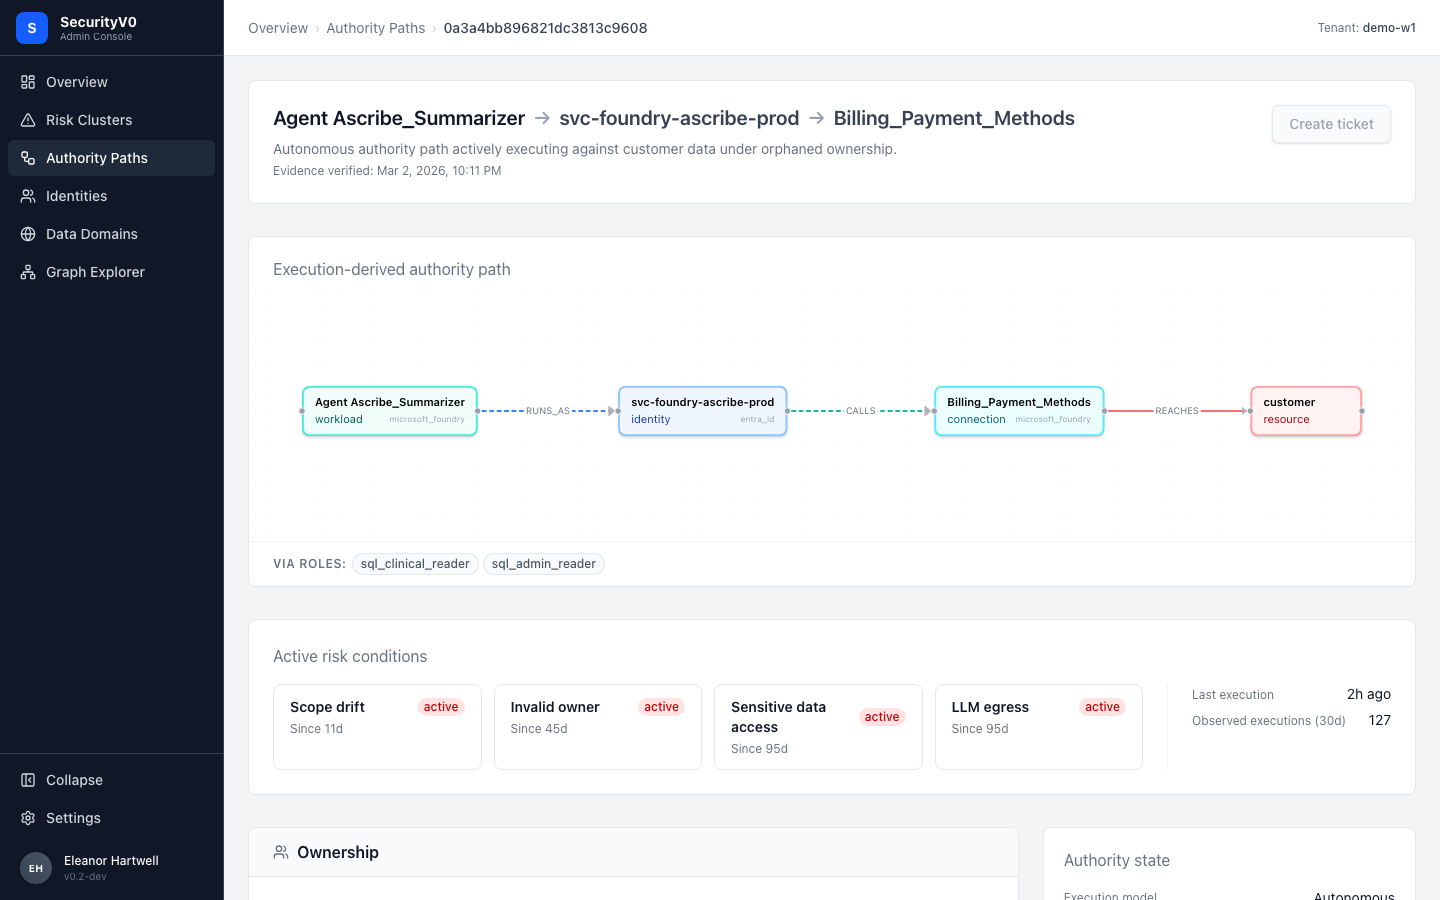
What renders: Header with path name + plain-English description ("Autonomous authority path actively executing against customer data under orphaned ownership"), visual flow diagram (workload → identity → connection → resource with RUNS_AS / CALLS / REACHES edge labels), active risk conditions cards (scope drift since 11d, invalid owner since 45d, sensitive data access since 95d, LLM egress since 95d), execution metrics, "Create ticket" button.
| Spec Requirement | Current UI | Status |
|---|---|---|
| Execution path diagram (dominant, above fold) | Present — flow diagram with color-coded nodes | Aligned |
| Active risk conditions strip | Present — cards with "since Xd" durations | Aligned |
| Runtime activity (30d executions big number) | Present but not visually dominant | Gap — should be larger |
| Ownership decomposition by boundary (automation owner, SP owner, app reg owner) | Shows ownership but decomposition unclear | Gap |
| Evidence grade indicator | Not present | Gap |
| "Create ticket" button | Present | Aligned |
| Plain-English header description | Present | Aligned |
This page is the strongest CISO-facing artifact in the platform. The visual flow diagram makes abstract graph relationships tangible. The risk condition cards with duration create urgency. This should be the primary page promoted for executive demos and the first candidate for PDF/share export.
Exposures
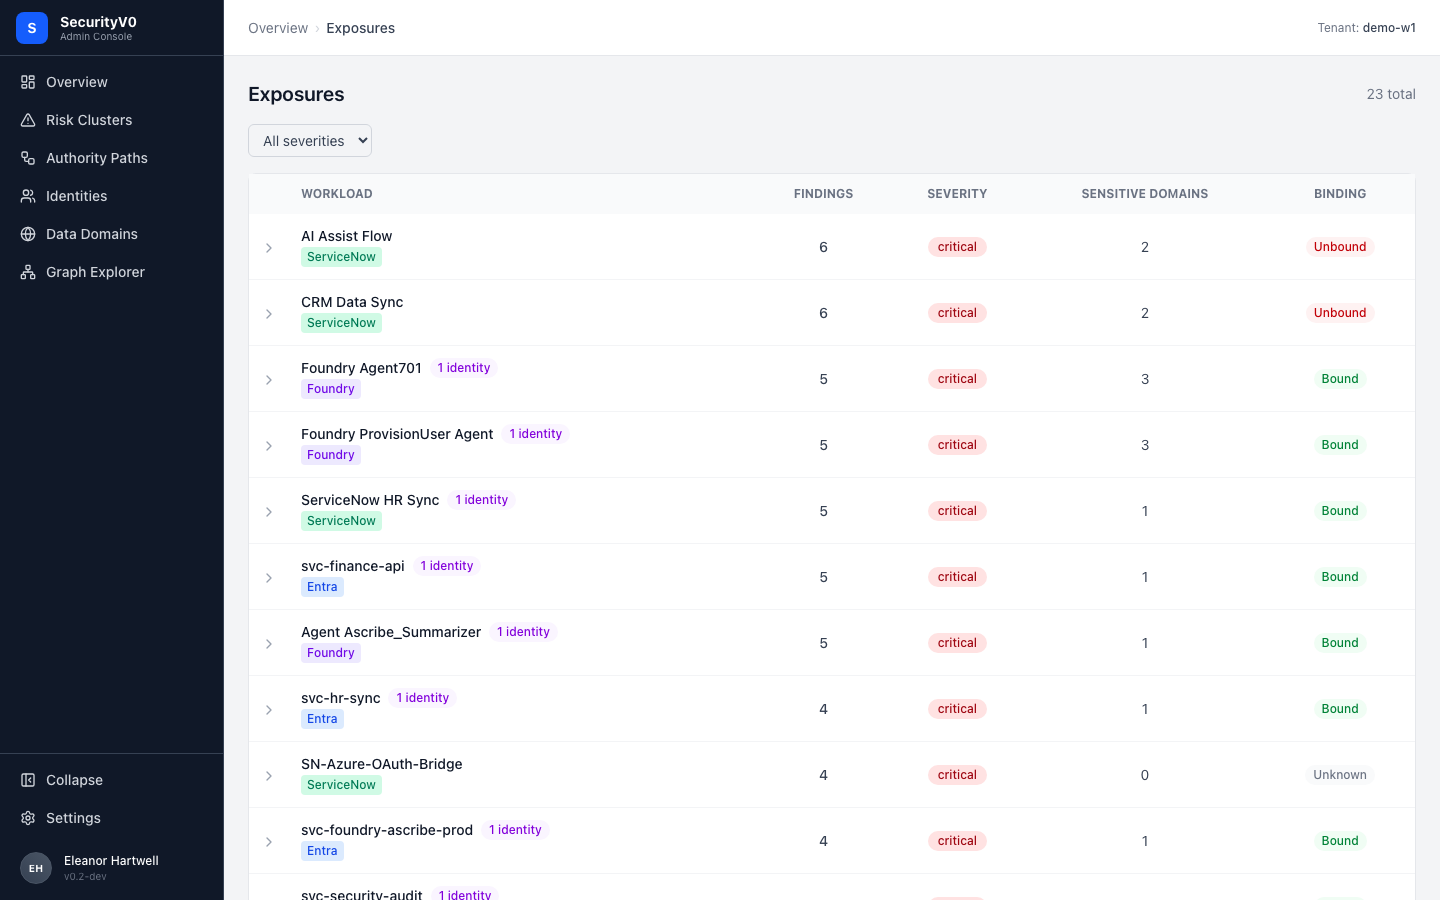
What renders: Table of 23 workloads with columns: Workload (with source badge), Findings, Severity, Sensitive Domains, Binding.
CISO assessment: Partially readable. The red "critical" severity badges are immediately alarming. Source badges (ServiceNow, Foundry, Entra) help with context. However, the "Binding" column (Bound/Unbound) is cryptic without explanation. All 23 rows showing "critical" reduces the signal — if everything is critical, the classification loses meaning on this page.
Recommendation: Add summary bar ("6 of 23 workloads are Unbound — operating without verified identity binding"), add tooltip on "Binding" column header.
Findings
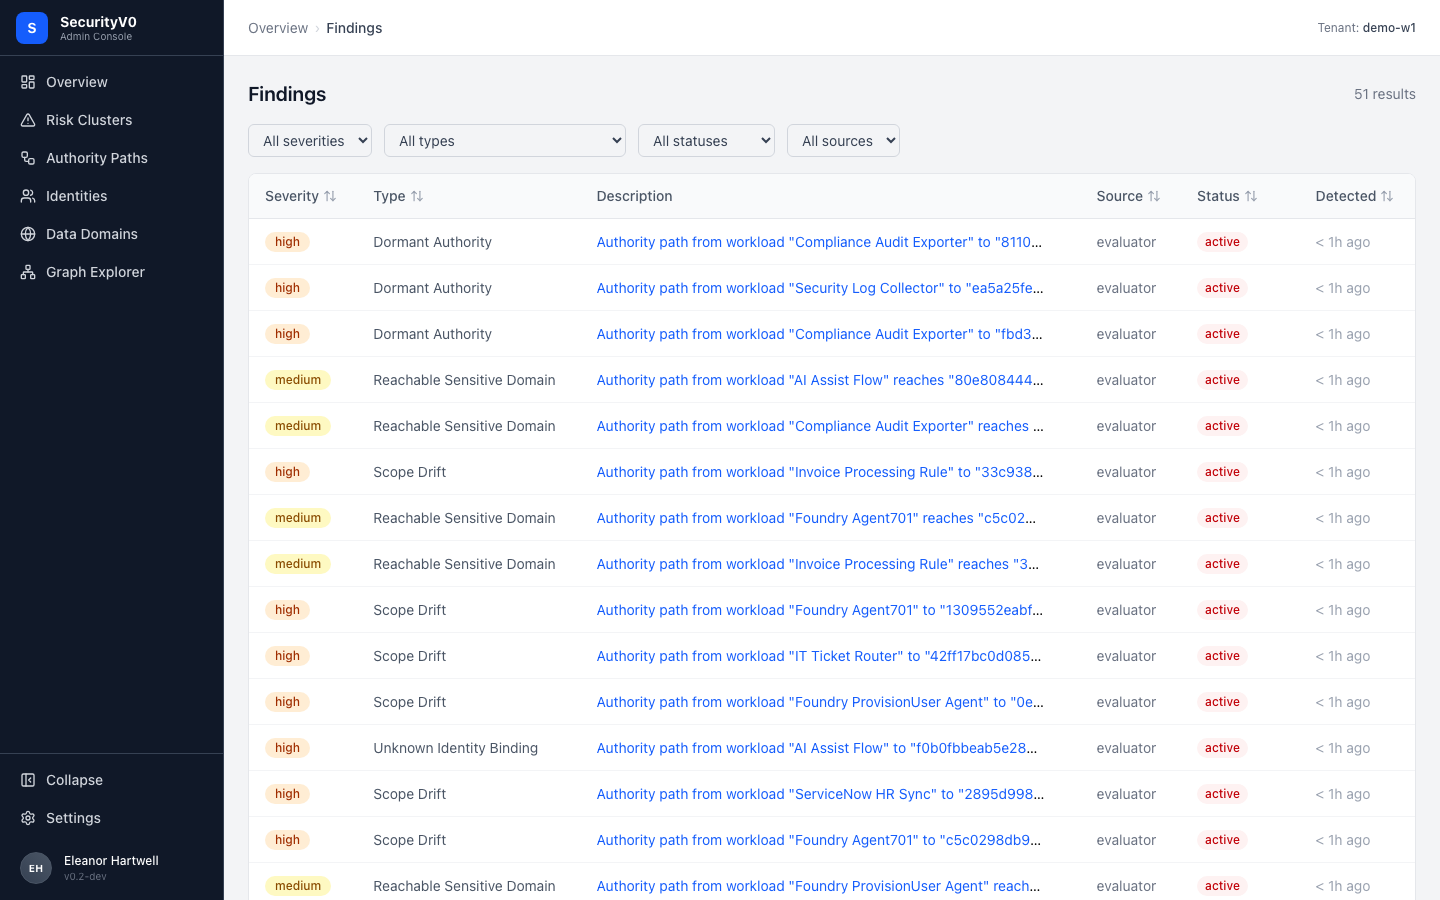
What renders: Flat table of 51 findings with columns: Severity, Type, Description (truncated text with entity hashes), Source, Status, Detected.
CISO assessment: No. This is the least CISO-friendly data page. Descriptions contain hash identifiers (ea5a25fe...), all sources show "evaluator", all statuses show "active" — the uniformity removes visual triage value. 51 findings in a flat table with no grouping or visual summary is overwhelming. Production datasets with hundreds of findings would amplify this problem significantly.
Spec alignment: The product specs say findings should be surfaced within the cluster → path drill-down flow, not as a standalone flat table. The Findings column in the paths table and the risk conditions on the path detail already handle this correctly. This standalone page is analyst territory.
Recommendation: Consider demoting this page from primary nav to an analyst sub-section, since the data is already surfaced effectively in the cluster → path drill-down. If retained as a top-level page, add grouping by finding type with counts per severity, replace hash IDs with human-readable names, and add a summary chart at the top.
Data Domains
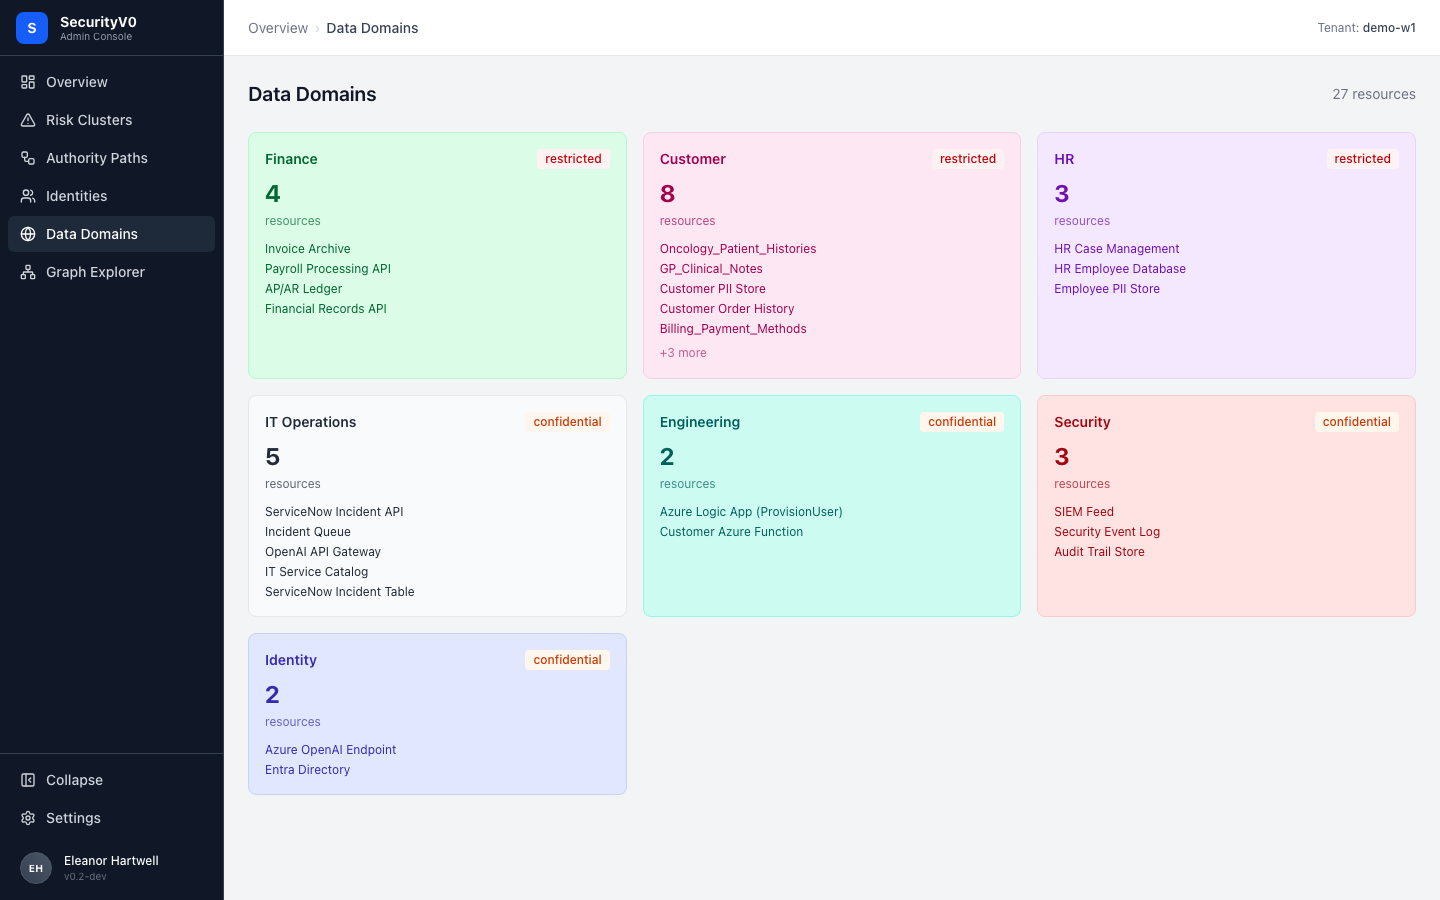
What renders: Card layout showing 7 domains (Finance, Customer, HR, IT Operations, Engineering, Security, Identity) with resource counts, sensitivity classification (restricted/confidential), and resource name lists.
CISO assessment: Yes. This is the most naturally CISO-readable page. CISOs understand data classification (restricted vs confidential) intuitively. Domain names map to business functions. Resource names (Oncology_Patient_Histories, Billing_Payment_Methods) convey real-world meaning.
Recommendation: Add "Reached by X authority paths" count to each domain card to show exposure. Add warning badge for domains involved in active findings.
Execution Chains
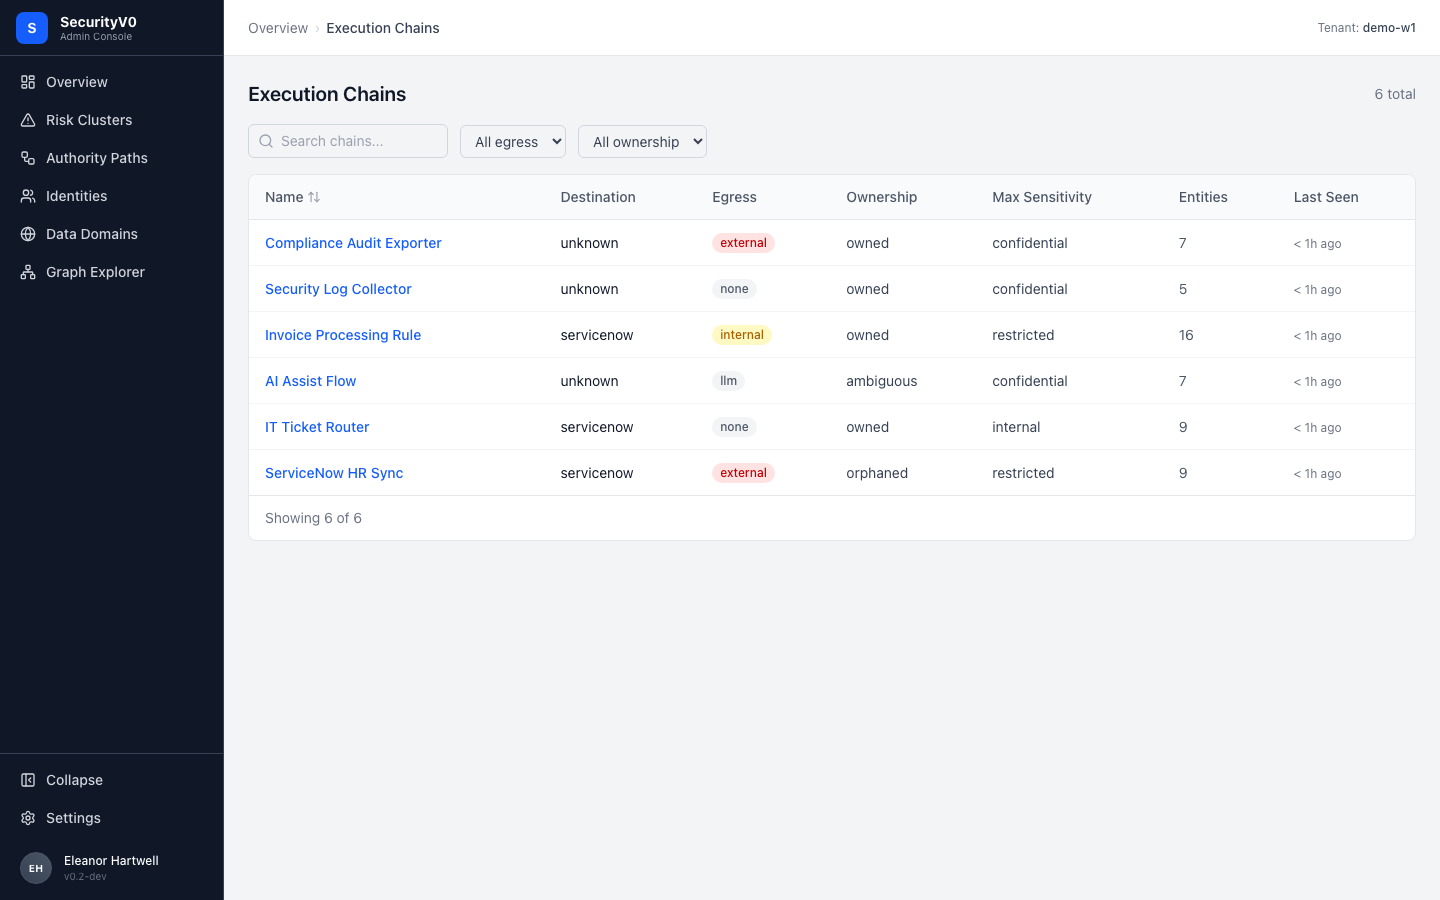
What renders: Compact table of 6 chains with: Name, Destination, Egress (external/internal/llm badges), Ownership (owned/orphaned/ambiguous), Max Sensitivity, Entities, Last Seen.
CISO assessment: Partially readable. The badge color-coding for Egress (red external, green internal, yellow llm) is effective. "Ownership: orphaned" is immediately concerning. However, what an "execution chain" actually is requires explanation.
Recommendation: Add subtitle explaining execution chains, add composite "Risk Level" column synthesizing egress + ownership + sensitivity.
Graph Explorer
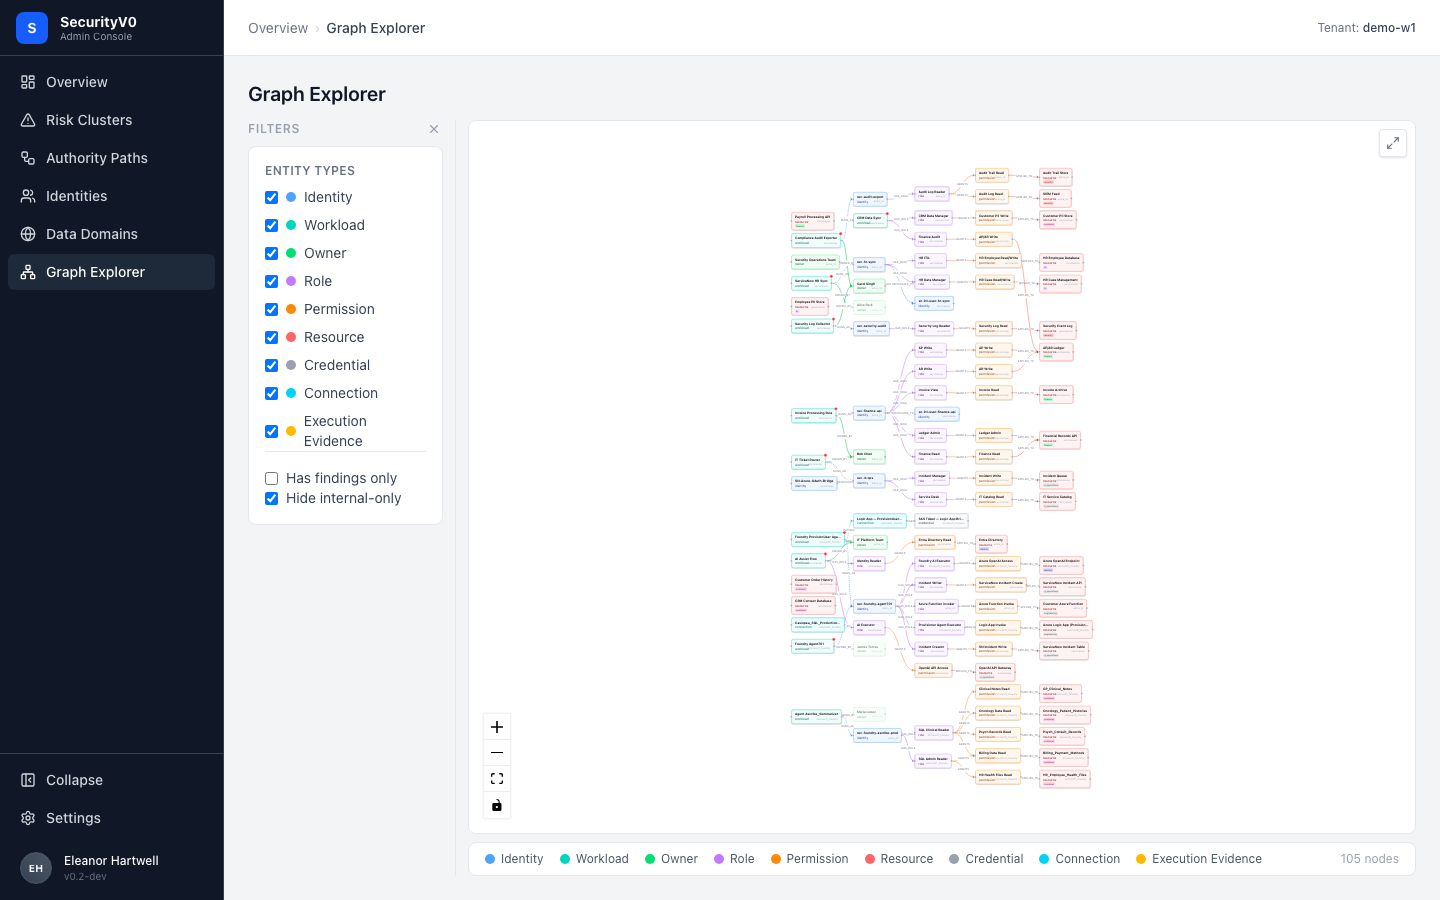
CISO assessment: No. The full 105-node view is unreadable at default zoom — node labels are illegible. This is correctly scoped as an analyst exploration tool and the Notion docs do not prescribe it for CISOs.
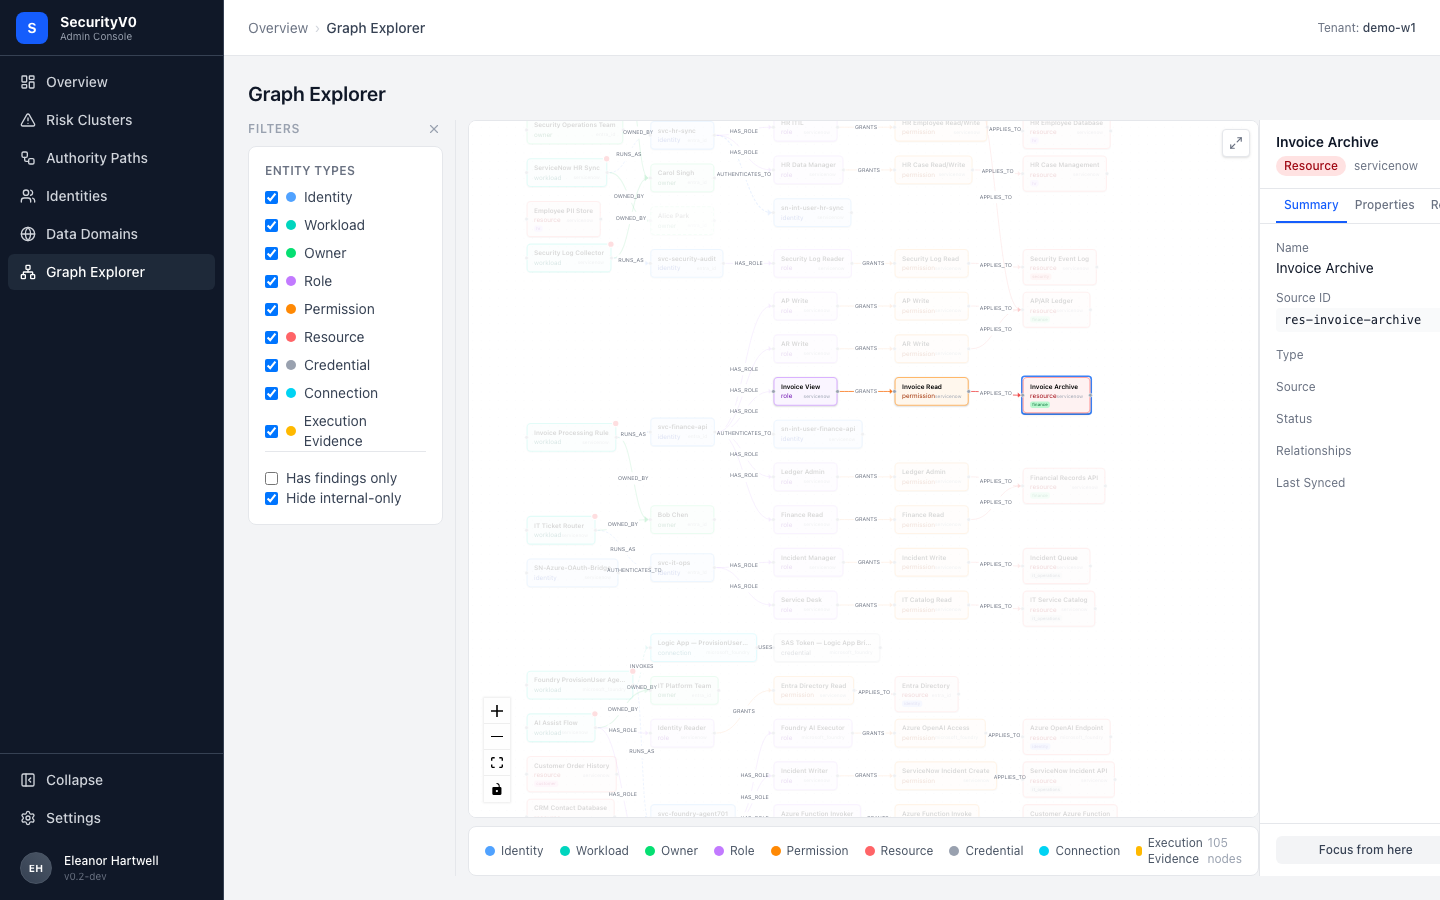
Note: The focus mode (second screenshot) is dramatically more readable. Edge labels (OWNED_BY, HAS_ROLE, GRANTS, RUNS_AS) become visible and create a readable narrative. Consider defaulting the graph to a "top risk paths" preset rather than showing all 105 nodes.
Identities
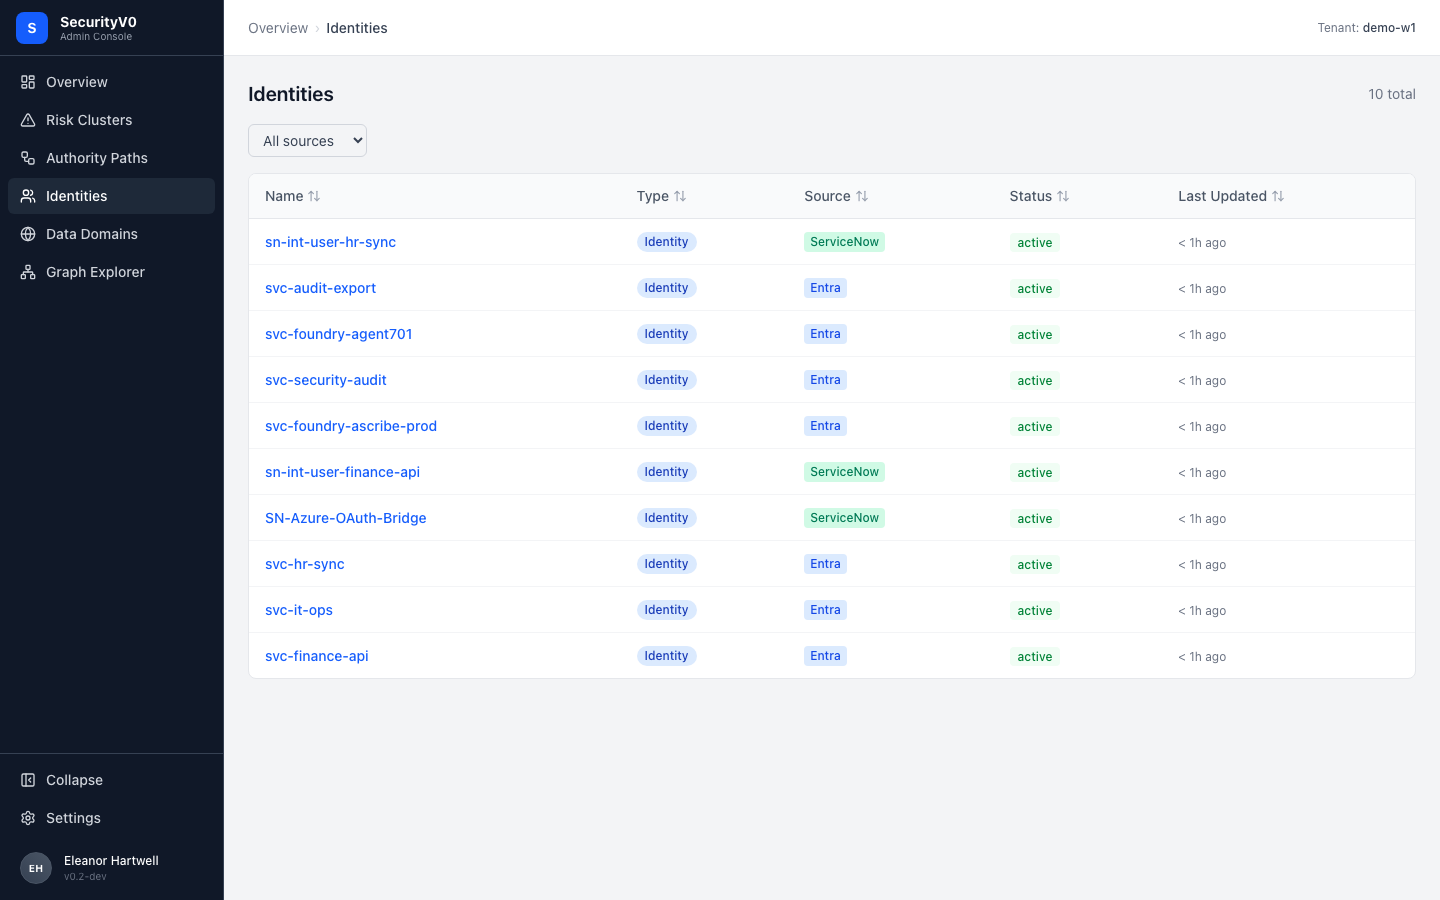
CISO assessment: Yes. Only 10 rows, descriptive names (svc-hr-sync, svc-audit-export), source badges. A CISO can immediately see: "10 service identities, split between Entra and ServiceNow, all active."
Recommendation: Add "Findings" count column to show which identities are problematic. Add "Owner" column for accountability.
Entity Detail
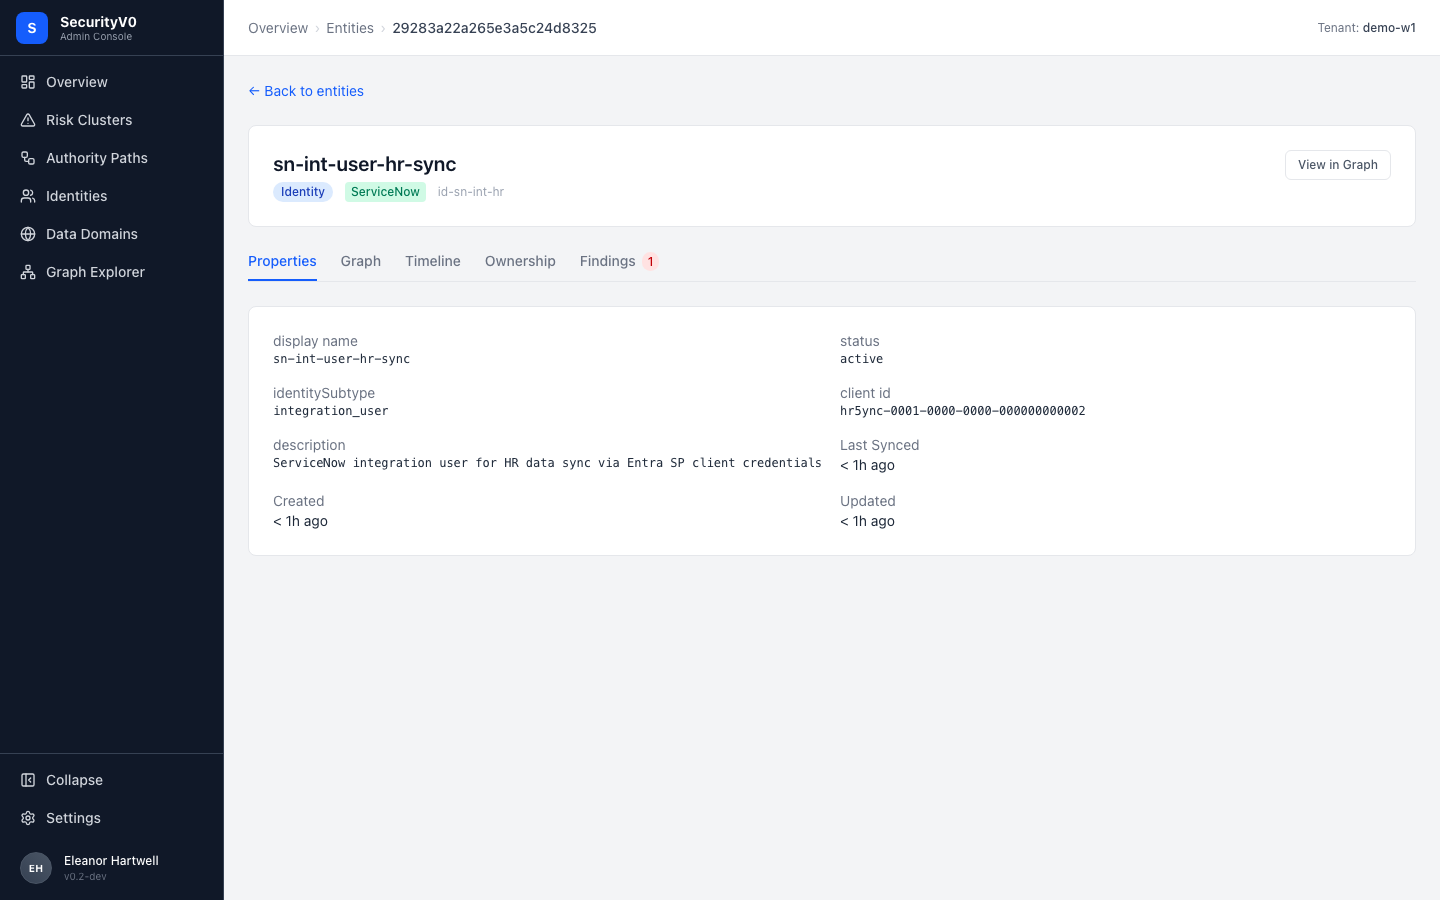
CISO assessment: Partially. The entity description is clear ("ServiceNow integration user for HR data sync via Entra SP client credentials"). The Findings tab with red "1" badge draws attention. But raw properties (client id, identitySubtype) are technical.
Note: The breadcrumb uses a hash ID (29283a22a265e3a5c24d8325) instead of the entity name — this should display the human-readable name.
Operator Pages (Settings, Syncs, Temporal)
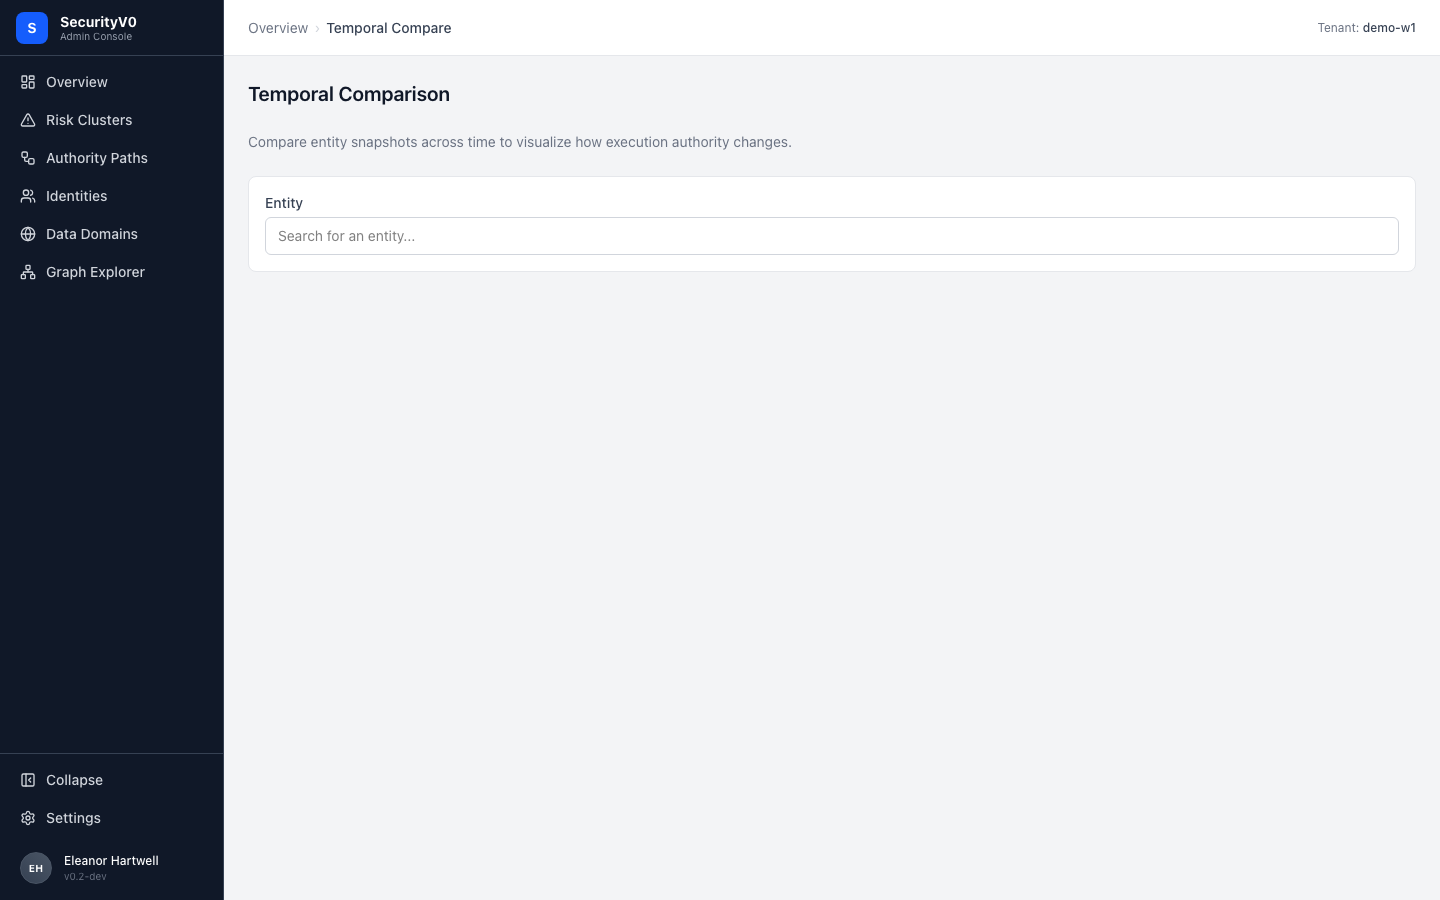
These are correctly scoped as operator/analyst tools. Not CISO-facing. The Temporal Compare page has a notable UX issue: it's a dead end without suggestions — no pre-populated entities, no "recently changed" prompts.
Critical Gaps (Sorted by CISO Impact)
1. Missing Verdict Sentences on Cluster Cards
Spec: Each cluster card must include a composable sentence:
"
<N>autonomous paths exercised<Domain>-scoped authority and invoked<Endpoint Type><X>times in the last 30 days."
Current: Path counts and domain tags only. A CISO must mentally assemble meaning.
Fix effort: Low — data already present on each card (path count, execution count, domains). This is a template rendering change.
2. Missing Evidence Grades (A/B/C)
Spec: The execution evidence feasibility study recommends visible grades:
- Grade A — Confirmed execution (deterministic proof from logs)
- Grade B — Inferred execution (temporal correlation)
- Grade C — Standing authority only (no execution evidence)
This is the platform's competitive differentiator ("we show what DID execute, not what COULD") and it is not visible anywhere in the UI yet.
Fix effort: Medium — requires the evidence grade materializer (planned in the implementation plan).
3. Dashboard Title Framing
Spec: The Clarity spec and UX feedback docs use execution-determined language — e.g., "Observed Autonomous Execution (30d)."
Current: "Autonomous Authority Surface" — sounds abstract rather than execution-determined.
Suggestion: Align the dashboard title with the spec's execution-determined framing. The exact wording should be iterated with the product team, but the direction is clear: foreground "observed execution" rather than "authority surface."
Fix effort: Trivial — text change only.
4. Hero Metric: Execution Count, not Path Count
Spec: Tile 1 should be total executions (big number, execution-determined). Tile 2 should be total executed paths.
Current: Tile 1 shows path count (29). Execution count exists in cluster cards (681, 663, etc.) but is not promoted to the top level.
Fix effort: Low — aggregate execution count from API and display as hero tile.
5. Missing Trend Deltas on Hero Metrics
Spec: "+/- vs prior 30d" on key metrics.
Current: Cluster cards show "+9 new paths (30d)" but hero tiles have no trend.
Fix effort: Low-Medium — requires posture snapshot comparison (data exists in posture_snapshots collection).
6. Ownership Decomposition by Boundary
Spec: Path detail should show three distinct ownership roles:
- Automation/agent owner (business owner)
- Service principal owner (runtime identity)
- App registration owner (config identity)
Current: Shows ownership but unclear whether it decomposes by these three boundaries.
Fix effort: Medium — requires ownership boundary mapping in the evaluator.
What Already Works (Aligned with Spec)
These elements should be preserved and replicated:
- Cluster contextual banner — Plain-English risk statement when filtering by cluster
- Authority Path Detail flow diagram — The strongest CISO artifact; makes graph relationships tangible
- Risk condition cards with "since Xd" — Creates urgency and accountability
- P0/P1 priority badges — Immediately recognizable severity
- Data Domains card layout — Natural business language, CISO-intuitive
- Progressive disclosure flow — Overview → Cluster → Paths → Detail
- "Create ticket" button — Enables CISO-to-analyst workflow
- Source system badges — Color-coded origin identification
- "+N new paths (30d)" trend indicators on cluster cards
Recommendations for Next Iteration
| Priority | Change | Effort | Impact |
|---|---|---|---|
| 1 | Add verdict sentences to cluster cards | Low | High — immediate CISO comprehension |
| 2 | Align dashboard title with spec's execution-determined framing | Trivial | High — frames the product narrative |
| 3 | Promote total execution count as hero tile | Low | High — execution-determined positioning |
| 4 | Add evidence grade indicator (A/B/C) to authority path rows | Medium | High — competitive differentiator |
| 5 | Add trend deltas to hero metrics | Low-Medium | Medium — shows posture direction |
| 6 | Decompose ownership by boundary in path detail | Medium | Medium — accountability clarity |
| 7 | Replace hash IDs in breadcrumbs with entity names | Trivial | Low — polish |
| 8 | Add "Risk Paths" preset to Graph Explorer | Low | Low — reduces graph overwhelm |
QA Test Results Reference
Both QA suites ran against Docker build on localhost:8080 with demo-w1 tenant.
Visual QA (11 pages)
| Page | Status | Load (ms) |
|---|---|---|
| Dashboard | PASS | 633 |
| Exposures | PASS | 635 |
| Findings | PASS | 707 |
| Entities | PASS | 673 |
| Identities | PASS | 605 |
| Data Domains | PASS | 605 |
| Execution Chains | PASS | 607 |
| Graph Explorer | PASS | 647 |
| Syncs | PASS | 618 |
| Temporal Compare | PASS | 624 |
| Settings | PASS | 596 |
Navigation flow: 7/7 sidebar links correct.
UX Audit (10 flows)
| Flow | Status | Duration |
|---|---|---|
| First-Run Experience | PASS | 7.6s |
| Overview → Cluster Detail | PASS | 7.9s |
| Authority Paths → Filter → Expand → Detail | PASS | 6.5s |
| Graph Explorer → Click → Focus | PASS | 8.1s |
| Identities → Entity Detail | PASS | 4.8s |
| Settings Page | PASS | 2.7s |
| Interaction Design | PASS | 4.3s |
| Visual Consistency | PASS | 7.4s |
| Accessibility | PASS | 9.1s |
| Error Scenarios | PASS | 1.7s |
Performance Metrics
| Page | Load (ms) | Network Reqs | Failed | Console Errors | DOM Nodes |
|---|---|---|---|---|---|
| Overview | 2172 | 5 | 0 | 0 | 219 |
| Clusters | 2126 | 4 | 0 | 0 | 192 |
| Authority Paths | 2133 | 4 | 0 | 0 | 863 |
| Identities | 2111 | 4 | 0 | 0 | 244 |
| Data Domains | 2116 | 4 | 0 | 0 | 158 |
| Graph Explorer | 3631 | 5 | 0 | 0 | 1803 |
| Settings | 2111 | 4 | 0 | 0 | 123 |
Implementation Status
Updated: 2026-03-08
The 8 prioritised recommendations from this review were implemented across two platform PRs:
sv0-platform PR #16 — CISO Readability Tier 1 (executive-facing UI)
Addressed recommendations:
- #1 Missing verdict sentences on cluster cards — Implemented
- #3 Dashboard title framing — Implemented (titles now use execution-determined language)
- #4 Hero metric: execution count, not path count — Implemented
- #5 Missing trend deltas on hero metrics — Implemented
sv0-platform PR #17 — CISO Readability Tier 2 (enriched table views)
Addressed recommendations:
- #2 Missing evidence grades (A/B/C) — Implemented
- #6 Ownership decomposition by boundary — Implemented
- Table column enrichment across Findings, Entities, and Authority Paths views
Deferred
The two remaining gaps identified in the review are tracked separately:
- Execution count as primary sort metric — being addressed in Plan C (Clarity UX Restructure)
- Authority Path Detail flow diagram enhancements — tracked in sv0-platform #40