Wiz UX Pattern Analysis — Findings & Posture Presentation
Executive Summary
Wiz's UX is built around a single organizing principle: the Security Graph is the product. Every finding, dashboard widget, and remediation flow derives from a graph-based data model that maps relationships between cloud resources, identities, vulnerabilities, and sensitive data. This graph-first architecture enables Wiz to present "toxic combinations" — compound risks where individually low-severity issues chain into critical attack paths — as the primary unit of attention. Their signature UX achievement is noise reduction: turning thousands of raw findings into dozens of prioritized, contextual issues that analysts trust.
SecurityV0's product model is fundamentally different. We are a deterministic review-and-action system for non-human identity governance, not a cloud-native vulnerability scanner. Our findings are deterministic truths about access paths, ownership, drift, and execution patterns — not probabilistic threat detections. This means some Wiz patterns apply directly (severity scanability, remediation click depth, information hierarchy), while others would compromise our model (probabilistic risk scoring, auto-remediation, inline blocking).
The key takeaway: Wiz excels at information hierarchy — showing the right amount of detail at each level (dashboard → list → detail → graph) and making the most critical information visible without clicks. Our current UI has the data but buries it behind too many clicks and too much visual uniformity. The patterns worth borrowing are structural (how to organize and reveal information), not architectural (we should not adopt graph-first detection or probabilistic scoring).
Methodology
Sources used:
- Wiz product blog (wiz.io/blog) — primary source for UI screenshots and feature descriptions
- Wiz documentation (docs.wiz.io) — feature reference and integration guides
- Wiz Academy (wiz.io/academy) — conceptual explanations with UI context
- Wiz landing pages (wiz.io/lp, wiz.io/solutions) — marketing screenshots of dashboards and graphs
- Google Cloud Architecture Guide (docs.cloud.google.com) — Wiz integration documentation with screenshots
- Third-party integrations (Steampipe, Port.io, Sekoia, RegScale, Tenable) — data model schemas revealing what fields exist on findings/issues
- User reviews (G2: 4.7/5 from 772+ reviews, PeerSpot) — user descriptions of UI patterns
- Practitioner blog posts (Medium, security blogs) — first-person accounts of using Wiz
- Conference coverage (Wizdom 2025, Futurum Group) — feature announcements
Limitations:
- No direct access to a Wiz instance. All observations are from public materials.
- Wiz's marketing screenshots are curated — real production views may differ in density and polish.
- Some UI details (exact color values, spacing, interaction states) are not visible from screenshots.
- Wiz's UI evolves rapidly; patterns described here reflect publicly available materials as of March 2026.
1. Findings List — Scanability at a Glance
How Wiz Does It
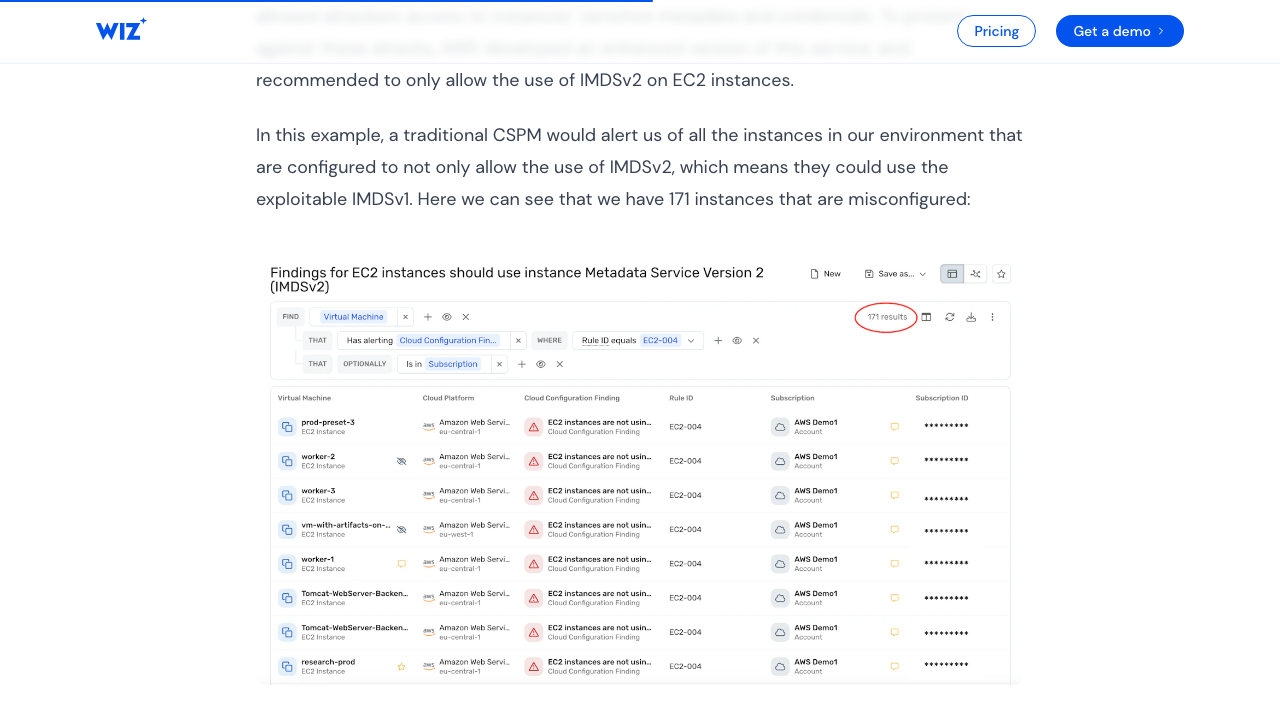 Wiz CSPM findings table: "EC2 instances should use Instance Metadata Service Version 2 (IMDSv2)" — showing 171 flagged instances with severity indicators, status, and resource metadata. Wiz's contextual filtering reduces this to 17 actionable issues by correlating exposure, privileges, and data sensitivity. Source: Wiz CSPM blog
Wiz presents findings as "Issues" in a filterable table view with severity-sorted rows. Each issue row displays inline:
| Visible Field | Purpose |
|---|---|
| Severity badge | CRITICAL / HIGH / MEDIUM / LOW / INFORMATIONAL — color-coded (red/orange/yellow/blue/gray) |
| Title | Short description derived from the control name (e.g., "Publicly exposed VM with critical network vulnerability") |
| Status | OPEN / IN_PROGRESS / RESOLVED / REJECTED |
| Resource | Affected entity name, type, and cloud platform indicator |
| Issue Type | TOXIC_COMBINATION / THREAT_DETECTION / CLOUD_CONFIGURATION |
| Created At | When detected |
| Due At | Auto-calculated deadline (Critical=30d, High=90d, Medium=90d, Low=365d) |
| Projects | Team/organizational ownership |
| Service Tickets | Linked Jira/ServiceNow ticket indicators |
Key design decisions:
- Default sort is severity-descending — critical items always appear first.
- Pre-filtered defaults — the default view shows OPEN + CRITICAL issues, not everything.
- Noise reduction as a feature — Wiz markets the "171 misconfigurations → 17 actionable issues" reduction. The graph engine filters before the human sees the list.
- Contextual severity — severity is not raw CVSS. It incorporates exposure (internet-facing?), privileges (admin?), blast radius, and data sensitivity. Users report this contextual severity has high trust and reduces "severity fatigue."
- Remediation bundles — related issues grouped by root cause, so fixing one root cause resolves multiple findings.
UX principle at work: Progressive disclosure via funnel architecture — Dashboard KPIs → filtered list → individual attack path → remediation. Each level reduces scope and increases detail.
Sources:
- Wiz CSPM blog — 171→17 reduction example
- Steampipe wiz_issue table — data model fields
- Port.io Wiz integration — entity snapshot schema
- Wiz reviews — user trust in contextual severity
How SecurityV0 Does It Currently
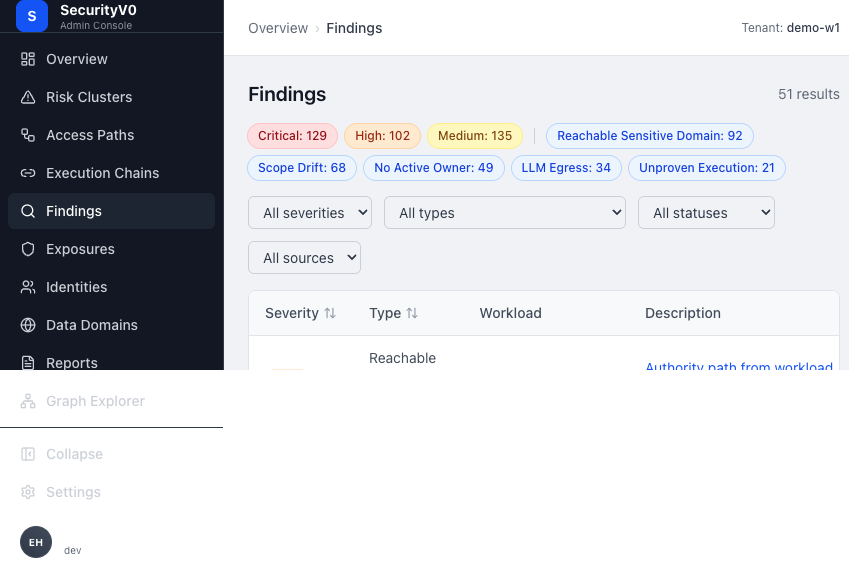 SecurityV0 findings list showing severity summary strip, filter bar, and table with 51 results. Note the severity pill counts (Critical: 129, High: 102, Medium: 135) and finding type tags (Reachable Sensitive Domain: 92, Scope Drift: 68, No Active Owner: 49).
Our Findings list page (/findings) displays:
| Visible Field | Notes |
|---|---|
| Severity badge | Critical/High/Medium/Low — color-coded |
| Type | Finding type formatted as human-readable text |
| Workload | Linked to entity detail |
| Description | Deterministic explanation — 2-line clamp with truncation |
| Source | Evaluator or connector origin |
| Status | active/acknowledged/remediated/false_positive |
| Detected | Relative time ago |
Summary strip at top: clickable severity pills (Critical/High/Medium/Low) and top 5 finding type counts.
Filter bar: DataTableFilters for severity, finding_type, status, source.
Pagination: Cursor-based, 50 items per page, with a truncation warning at 5,000+ items.
Visual Comparison
| Dimension | Wiz | SecurityV0 |
|---|---|---|
| Severity position | Left column, color-coded badge — first thing scanned | Left column badge — similar placement |
| Title/description visibility | Full short description visible inline | 2-line clamp truncation — descriptions cut off |
| Contextual severity | Incorporates exposure, privileges, blast radius | Raw evaluator severity — no contextual enrichment |
| Default sort | Severity-descending, pre-filtered to OPEN+CRITICAL | Chronological with severity filter available |
| Grouping | By severity, type, project, cloud platform, compliance framework | By severity and type counts in summary strip only |
| Noise reduction | Graph engine pre-filters; bundles related issues | No pre-filtering; no remediation bundling |
| Deadline/SLA | Due date visible inline, auto-calculated from severity | No deadline/SLA visible |
| Ticket status | Linked ticket indicators visible on list row | No ticket status on list view |
| Ownership | Project-based team attribution visible | Not visible on findings list |
Patterns to Borrow
-
Full description visibility — Remove the 2-line clamp or make it 4-5 lines. Finding descriptions are the most important text on this page; truncating them forces unnecessary clicks. Wiz shows full short descriptions inline.
-
Smart default sort and filter — Default to severity-descending with OPEN/ACTIVE pre-selected. Currently our list opens chronologically, burying critical items.
-
SLA/deadline indicators — Auto-calculate and show a remediation deadline per finding based on severity. This creates urgency without requiring manual triage. Wiz uses: Critical=30d, High=90d, Medium=90d, Low=365d.
-
Severity summary with counts — Our summary strip already does this well. Enhance it with a default filter: clicking "Critical (3)" should filter the list instantly.
-
Ticket/tracking status on list view — Show whether a finding has a tracked action or linked ticket without requiring a click into the detail page.
Patterns to Avoid (Our Model Differs)
-
Probabilistic contextual severity — Wiz re-scores severity using exposure and blast radius analysis. Our findings are deterministic evaluator outputs; re-scoring would undermine the "what is proven vs. inferred" standard Sergey mandated. Instead, we should make evidence confidence more visible.
-
Remediation bundling by root cause — Wiz groups findings that share a common fix. Our findings map to specific access paths with specific remediation actions; bundling would hide the path-level specificity that is our product's value.
2. Finding Detail — Evidence & Remediation
How Wiz Does It
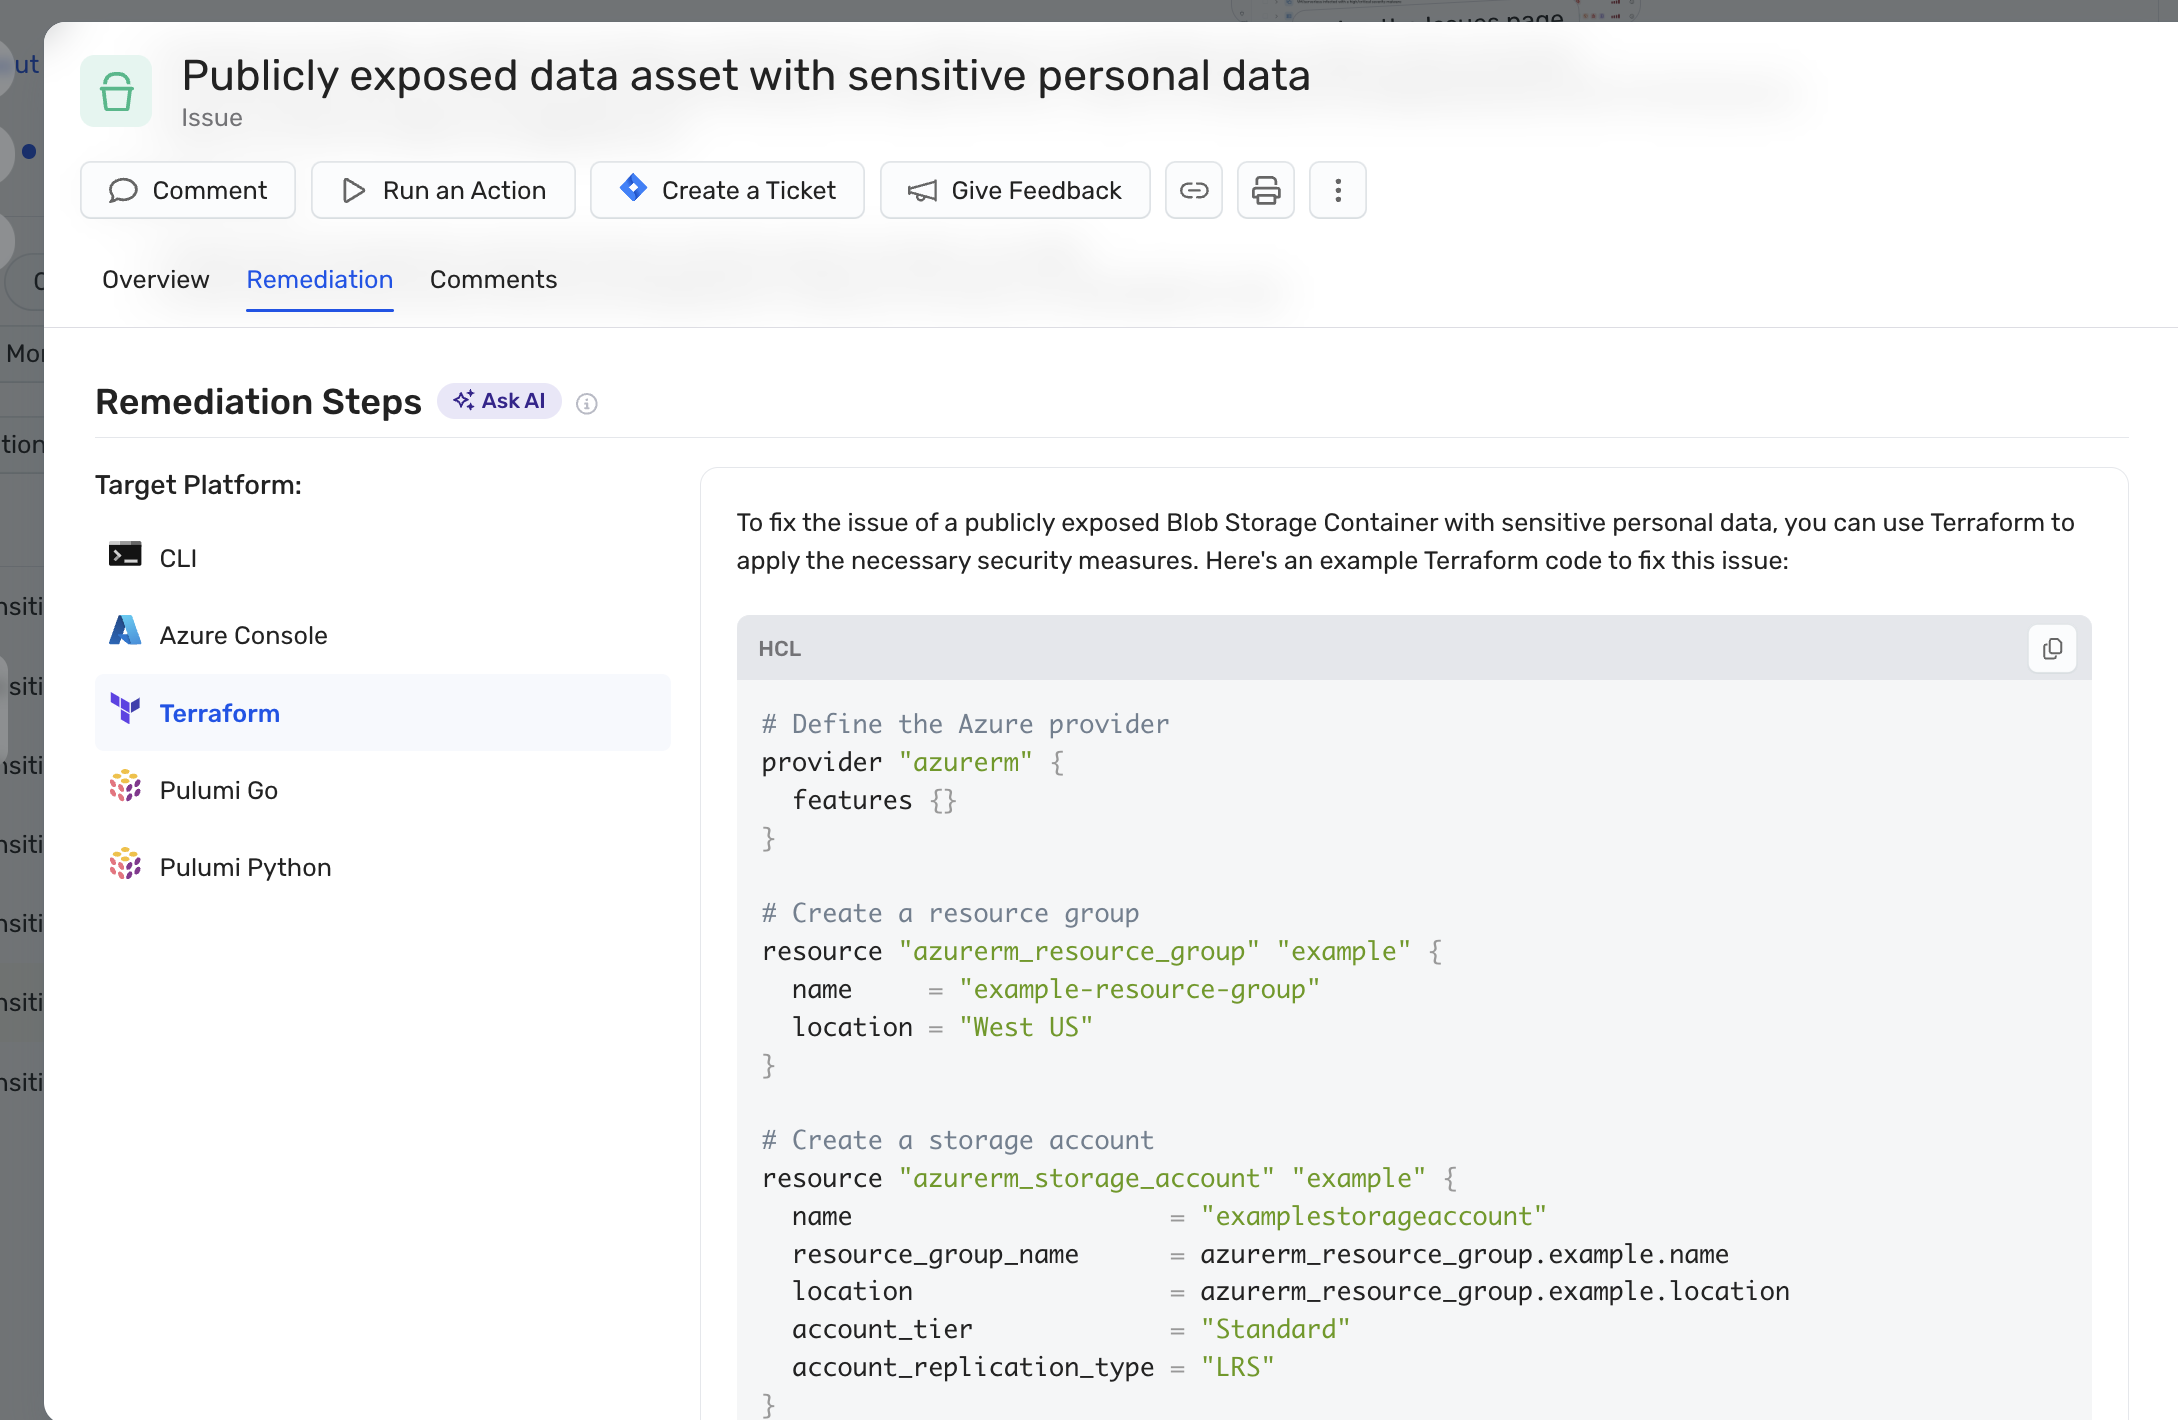 Wiz issue detail page for "Publicly exposed data asset with sensitive personal data." Tabs: Overview, Remediation, Comments. Action bar: Comment, Run an Action, Create a Ticket, Give Feedback. Remediation Steps panel with "Ask AI" button and Target Platform selector (CLI, Azure Console, Terraform, Pulumi Go, Pulumi Python) — shown here generating copy-paste Terraform HCL code. Source: Wiz AI-Powered Remediation blog
Wiz uses a full-page detail view (not a modal or side panel) with these sections:
Header bar: Title, severity badge, status, due date, project, assignee.
Core sections:
- Description — What was detected, derived from the control/rule definition.
- Security Graph Visualization — Node-and-edge attack path graph showing how the finding connects to resources, identities, and data. This is the signature visual element.
- Investigation Tab (Green Agent) — Step-by-step AI analysis chain with verdict (Remediate/Ignore), confidence score, and transparent reasoning. Users can verify how the recommendation was derived.
- Remediation Guidance — Multi-format, copy-pasteable instructions:
- CLI commands
- Terraform updates
- Kubernetes configuration changes
- CloudFormation / Pulumi (Go/Python)
- Cloud console steps
- For toxic combinations: sub-steps addressing each risk factor independently.
- Notes — User-added comments and discussion.
- Service Tickets — Linked Jira/ServiceNow tickets with bi-directional sync status.
Click depth: 1-2 clicks from list to actionable remediation. Remediation guidance is inline on the detail page (scroll down, 0 additional clicks after reaching the page). Ticket creation is a single click from the detail page, pre-populated with full context.
Evidence presentation:
- Security Graph attack path (visual)
- Validated external exposure screenshots ("what an attacker would see")
- Code-to-cloud lineage (source → build → artifact → runtime)
- Partially redacted samples of detected sensitive data
- Runtime validation (whether vulnerabilities are loaded into memory)
Sources:
- AI-Powered Remediation 2.0
- Green Agent introduction
- Wiz Security Graph for Cloud IR
- Dynamic Scanner Enhancement
How SecurityV0 Does It Currently
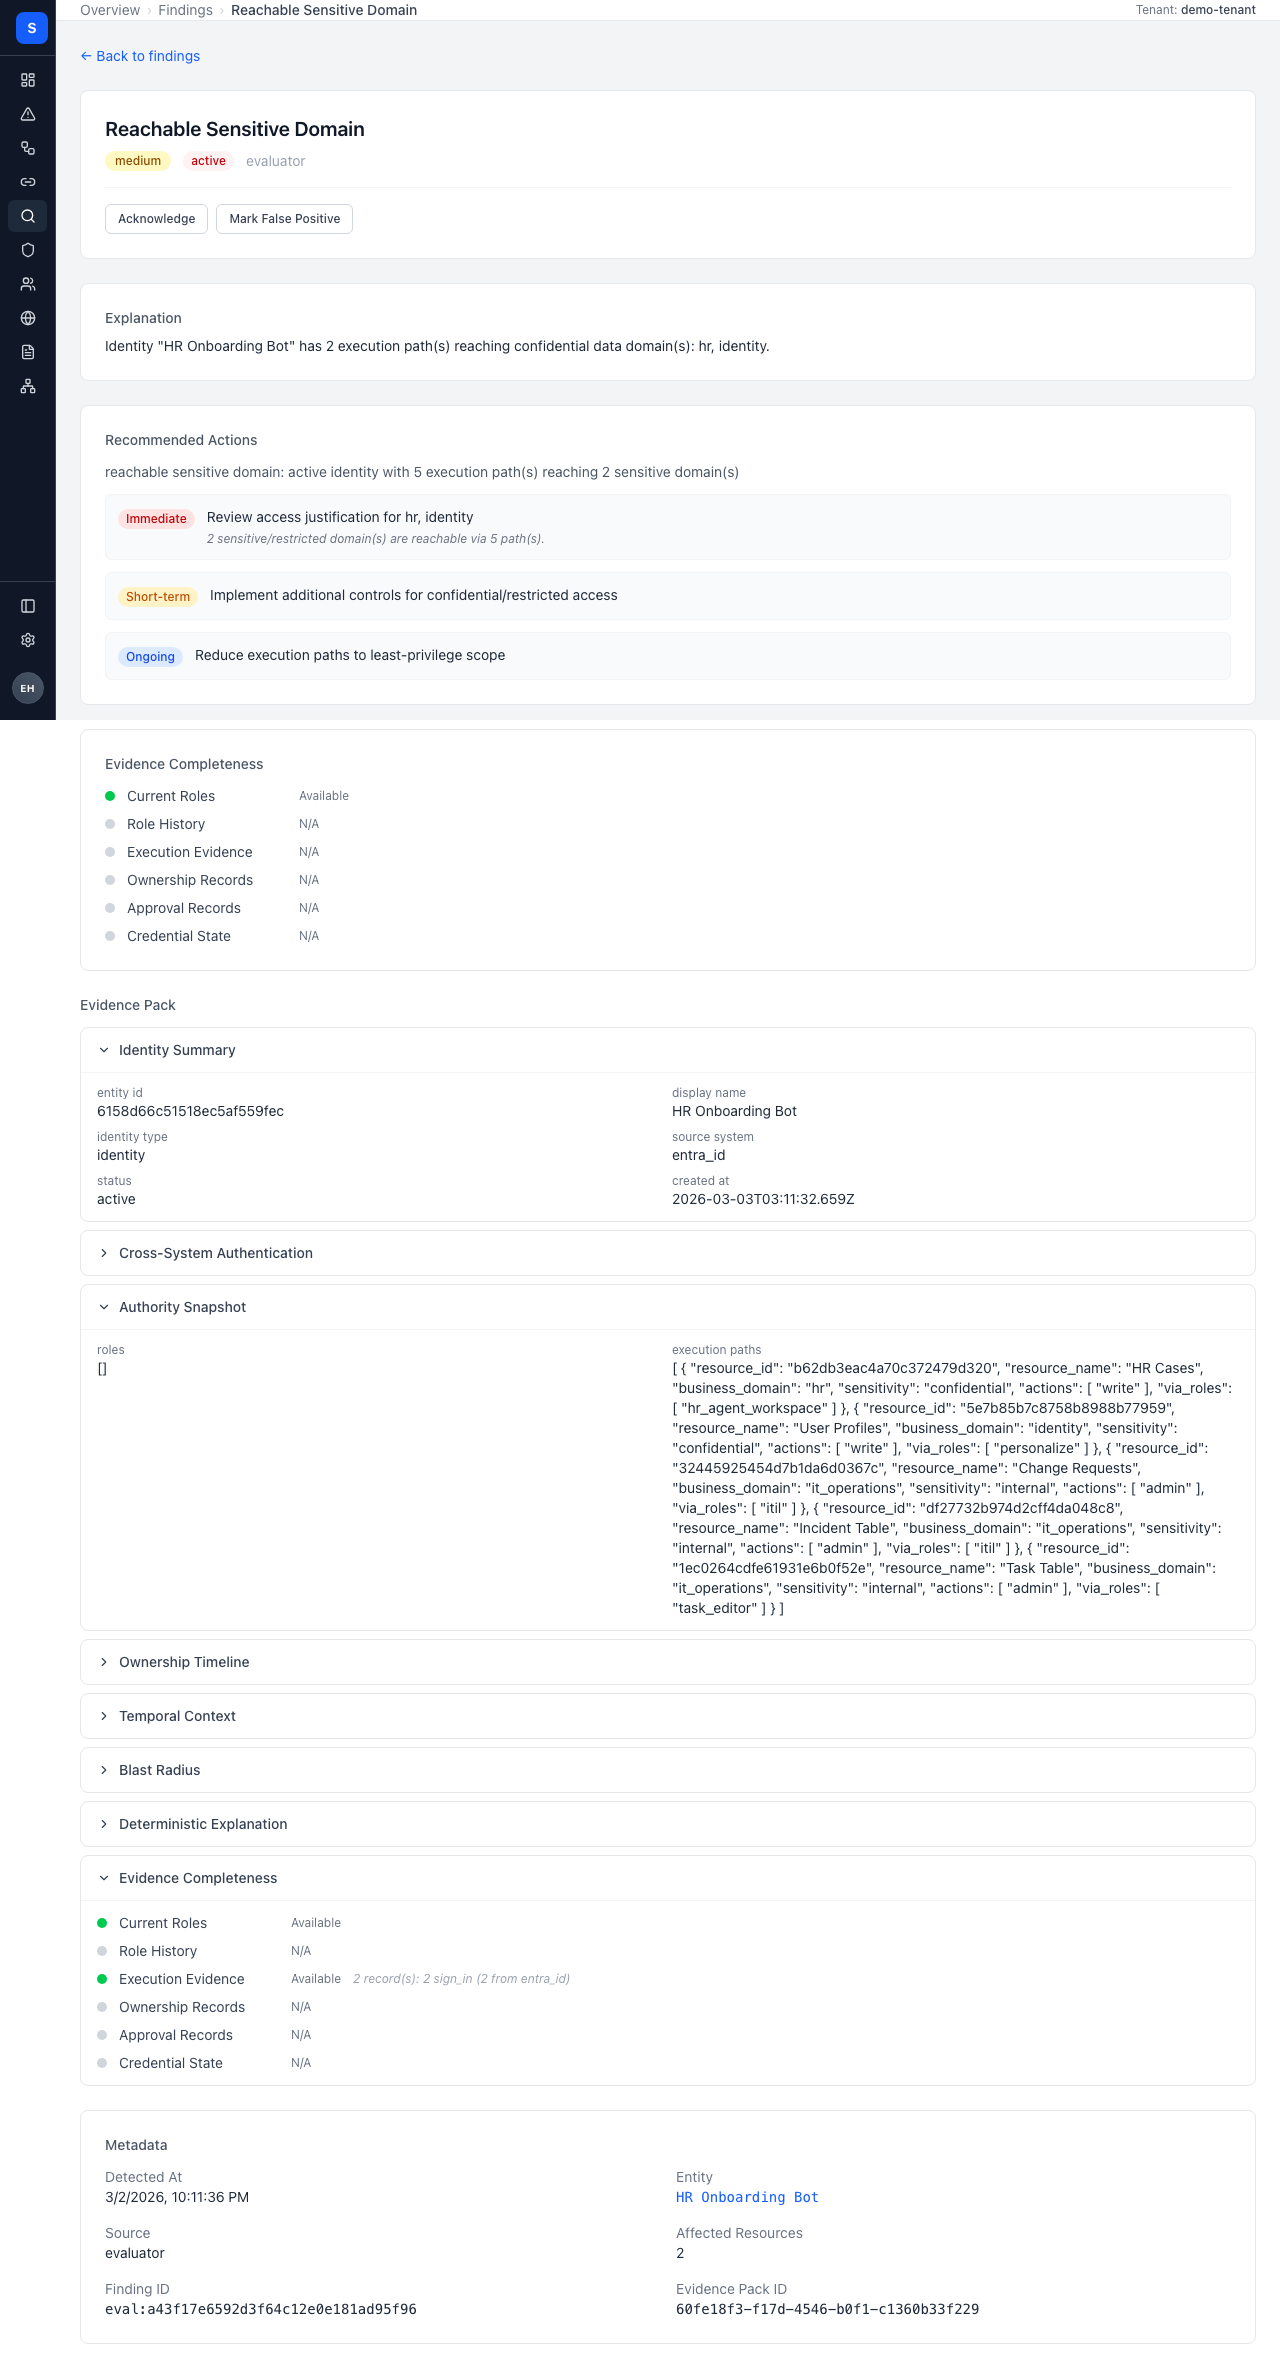 SecurityV0 finding detail page showing finding type, severity badge, deterministic explanation, remediation panel, and evidence pack sections.
Our Finding Detail page (/findings/:id) contains:
- Header card — Finding type title, severity badge, status badge, source label, status workflow (for evaluator findings).
- Explanation section — Deterministic explanation with entity ID → display name humanization.
- Recommended Actions — RemediationPanel with structured remediation steps.
- Scope Drift Detail — ScopeDriftDetail visualization (if applicable).
- Evidence Completeness — Bar chart showing completeness percentage.
- Evidence Pack Viewer — Multi-section viewer (9 sections: overview, execution_paths, roles_breakdown, etc.).
- Metadata Grid — Detected at, entity, source, affected resource count, finding ID, evidence pack ID.
Visual Comparison
| Dimension | Wiz | SecurityV0 |
|---|---|---|
| Layout | Full-page with distinct sections and tabs | Full-page, vertically stacked sections |
| Graph context | Attack path graph is the centerpiece | No graph on finding detail (graph is a separate page) |
| Remediation format | Multi-format copy-paste (CLI, Terraform, K8s) | Structured remediation steps |
| Click depth to remediation | 1 click (list → detail, guidance is inline) | 1 click to detail, then scroll — similar |
| Evidence presentation | Visual graph + screenshots + code lineage | Evidence pack viewer with 9 sections — data-rich but dense |
| Evidence confidence | Confidence score on AI verdicts | Evidence completeness bar — exists but buried |
| Ticket creation | 1-click inline, pre-populated | "Track Mitigation" button + modal |
| Resource deep-link | Direct link to cloud provider console | Link to entity detail page |
Patterns to Borrow
-
Evidence confidence front-and-center — Move evidence completeness from a buried bar chart to a prominent badge in the header card, next to severity. This directly addresses Sergey's directive that "what is proven vs. inferred" must be visible at scan-the-page level. Relates to GitHub issue #219.
-
Remediation as copy-paste actions — Our RemediationPanel already shows structured steps. Enhance with specific, copy-pasteable commands where the evaluator can generate them (e.g., exact
gcloudorawsCLI commands for role changes). -
Inline graph context — Show a simplified path visualization (workload → identity → destination with finding indicators) directly on the finding detail page, without requiring navigation to
/graph. The path header already exists; expand it with finding-relevant context.
Patterns to Avoid
-
AI investigation tab with verdicts — Wiz uses LLM-powered analysis to produce Remediate/Ignore verdicts. Our product is deterministic; findings are proven truths, not AI suggestions. Adding AI verdicts would undermine the trust model.
-
External exposure screenshots — Wiz's dynamic scanner captures "what an attacker would see." Our NHI/workload model doesn't have equivalent external exposure; our evidence is structural (roles, permissions, execution patterns), not network-facing.
3. Risk/Exposure Summary — Dashboard & Posture
How Wiz Does It
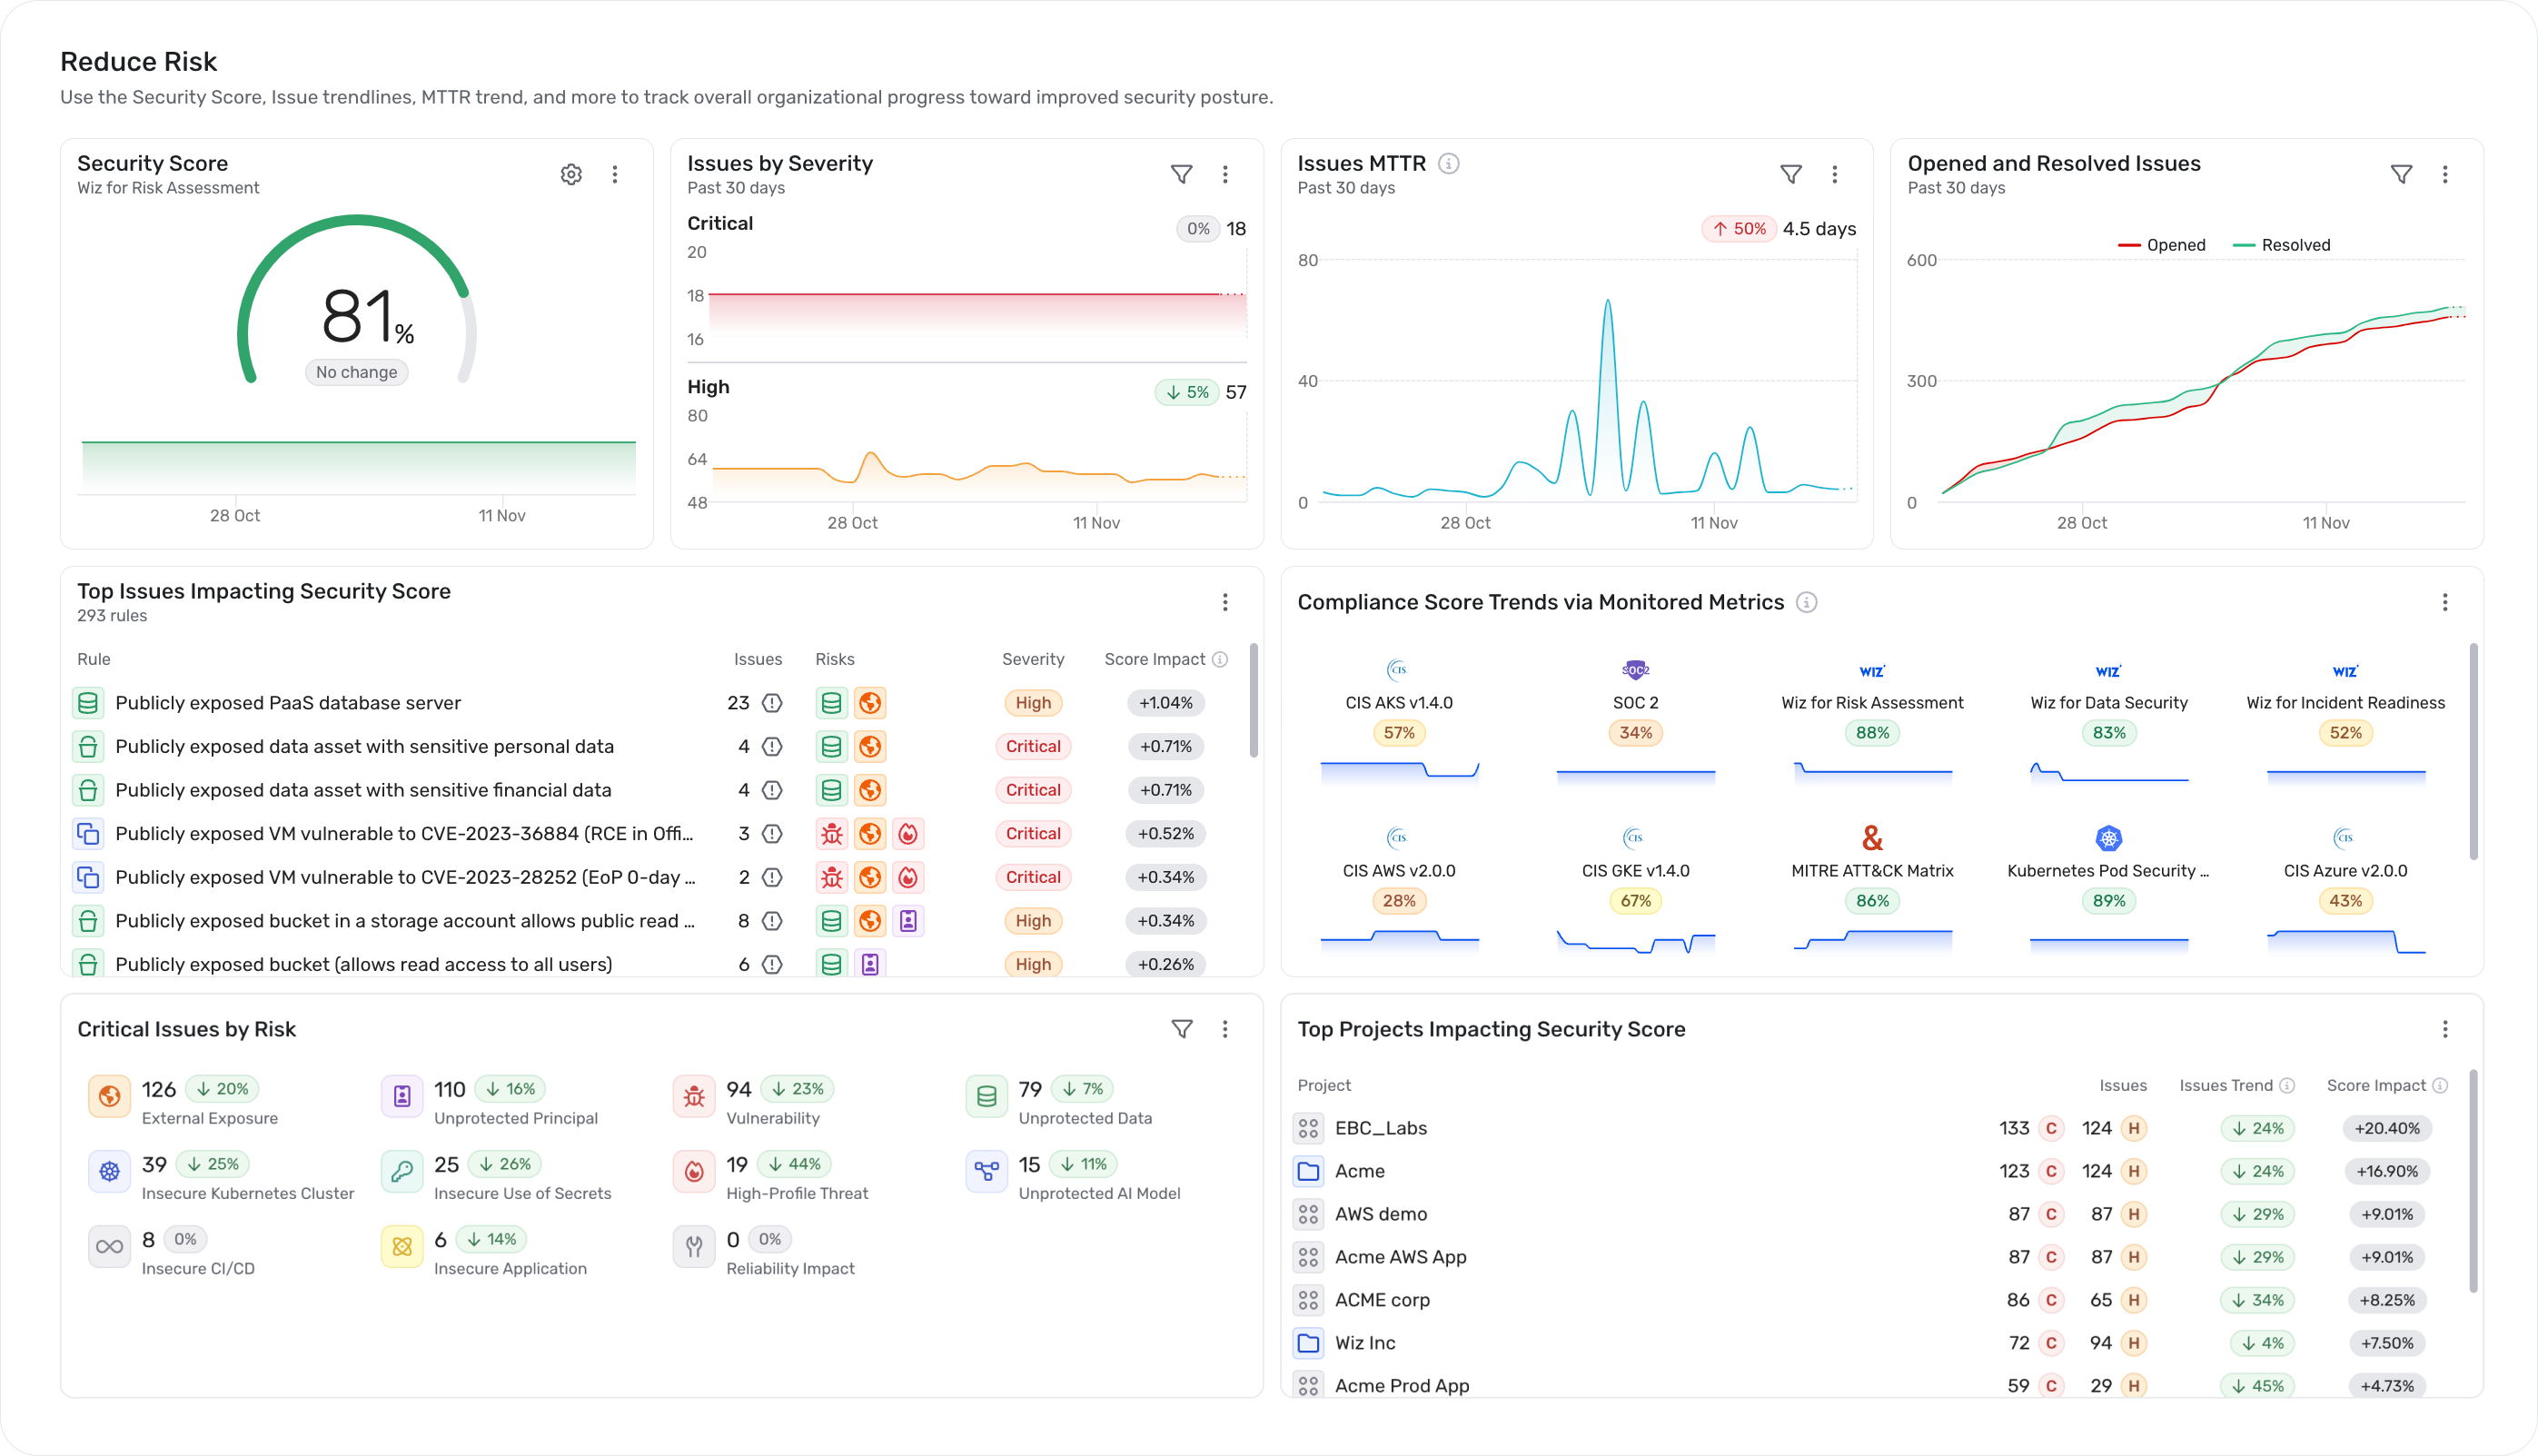 Wiz Champion Center: Security Score (81%), Issues by Severity breakdown, MTTR trend (4.3 days), opened vs. resolved issues trend, top issues impacting score, compliance score trends via monitored metrics, and top projects by risk. Source: Wiz Champion Center blog
Executive dashboard (Champion Center):
- Wiz Security Score — A single aggregate number customizable per compliance framework, shown with a trend line over time. This is the headline metric.
- MTTR (Mean Time to Remediate) — For critical issues, tracked with trend lines.
- Compliance benchmarks — Percentage-based alignment per framework.
- Adoption metrics — Active users, enabled integrations, user activity trends.
- Achievement badges — Gamified milestones ("Vulnerability Vanquisher," "Zero Criticals Club").
Cloud Health Score:
- 4-tier scale: High Risk / Moderate / Low / Optimal.
- Derived from 9 security domains, each scored individually, then rolled up.
Compliance Heatmap:
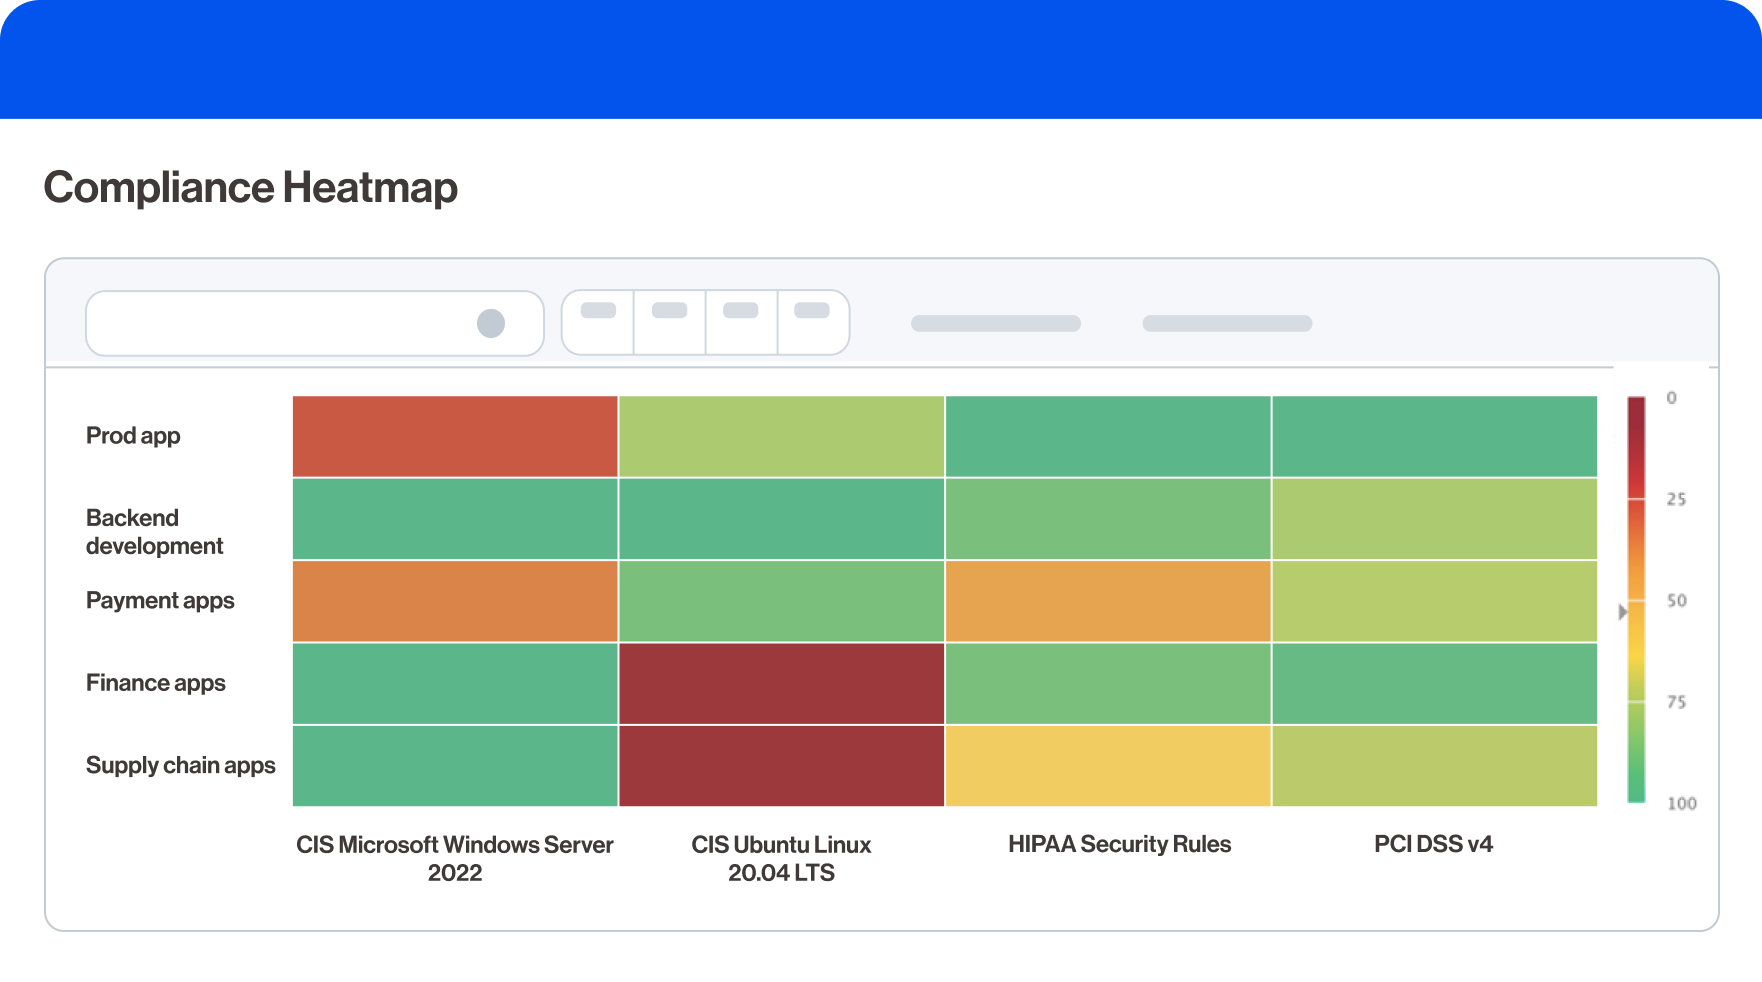 Wiz compliance heatmap: color-coded grid showing pass/fail status across frameworks (CIS Windows Server, CIS Ubuntu, HIPAA, PCI DSS v4) and environments (Prod, Backend, Payment, Finance, Supply chain). Red = failing, green = passing. Source: Wiz Compliance blog
- Bird's-eye color-coded grid across all compliance frameworks simultaneously.
- Each framework gets an overall compliance score (percentage).
- 250+ built-in frameworks (CIS, NIST, PCI DSS, HIPAA, GDPR) plus custom.
- "Weak spots" immediately visible through color differentiation.
Posture Issues:
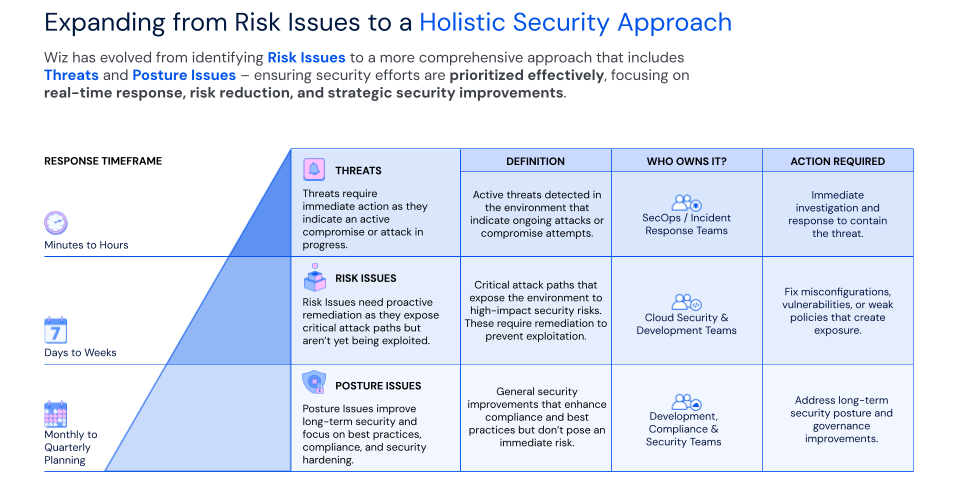 Wiz's two-tier issue model: Risk Issues (toxic combinations across domains) for urgent attack paths vs. Posture Issues (single-domain findings) for long-tail hygiene. Each type feeds different workflows — runtime threats, risk issues, and posture issues have distinct SLA and triage cadences. Source: Wiz Posture Issues blog
- Individual findings grouped by domain into trackable work items.
- Example: 264 vulnerability findings consolidated into a single "Windows OS Patch" Posture Issue.
- Each Posture Issue has SLA tracking and is assignable.
Drill-down flow: Dashboard KPIs → compliance heatmap/issues list → individual issue → Security Graph → specific resource.
Trend indicators: Wiz Security Score trend, MTTR trend, compliance percentage over time, risk reduction metrics, rate of recurrence.
Sources:
- Wiz Champion Center
- Cloud Security Self-Assessment
- Compliance Made Easy with Wiz
- Introducing Posture Issues
How SecurityV0 Does It Currently
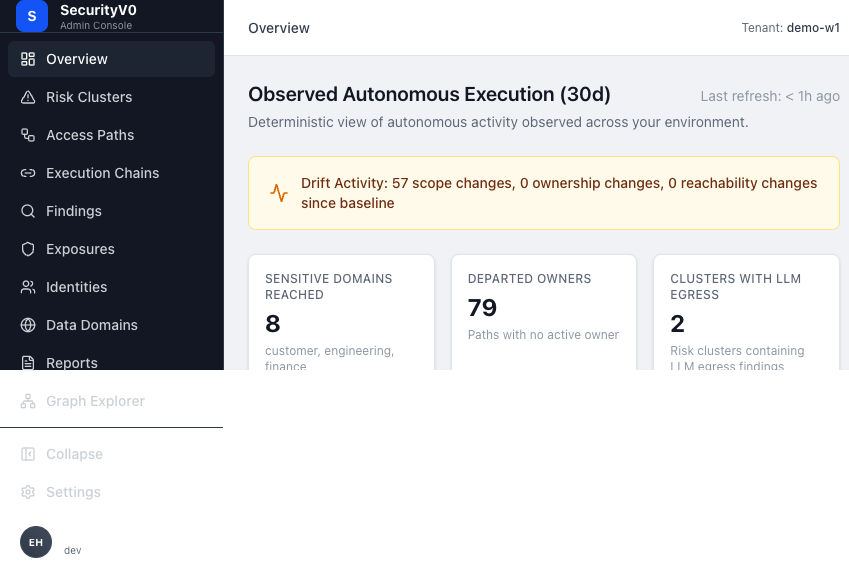 SecurityV0 overview page: "Observed Autonomous Execution (30d)" with drift activity banner, business metrics cards (8 Sensitive Domains, 79 Departed Owners, 2 Clusters with LLM Egress), and scan metrics.
Overview page (/):
- Drift Activity Banner — Scope changes, ownership changes, reachability changes since baseline.
- Business Metrics Cards (3 columns) — Sensitive Domains Reached, Departed Owners, Clusters with LLM Egress.
- "New Since Last Visit" Banner — Count of new findings with link.
- Top Risks — Top 3 authority paths by active finding count with execution confidence badges.
- Top Risk Clusters — Grid of PathRiskClusterCards (2-column).
- Scan Metrics — Observed Executions (30d) and Active Access Paths with delta badges.
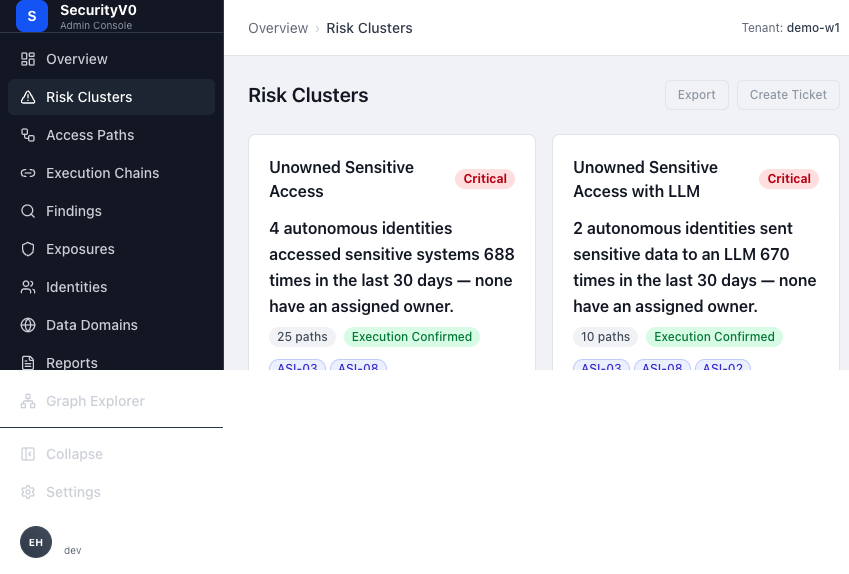 SecurityV0 risk clusters list: card-style layout with severity badges (Critical/High/Low), cluster narratives, path counts, and execution confirmation status.
Risk Clusters list (/clusters):
- 2-column grid of PathRiskClusterCards.
- Each card: cluster priority, narrative, metric cells (access paths, executions 30d, active/dormant %, domains, egress type), finding type pills.
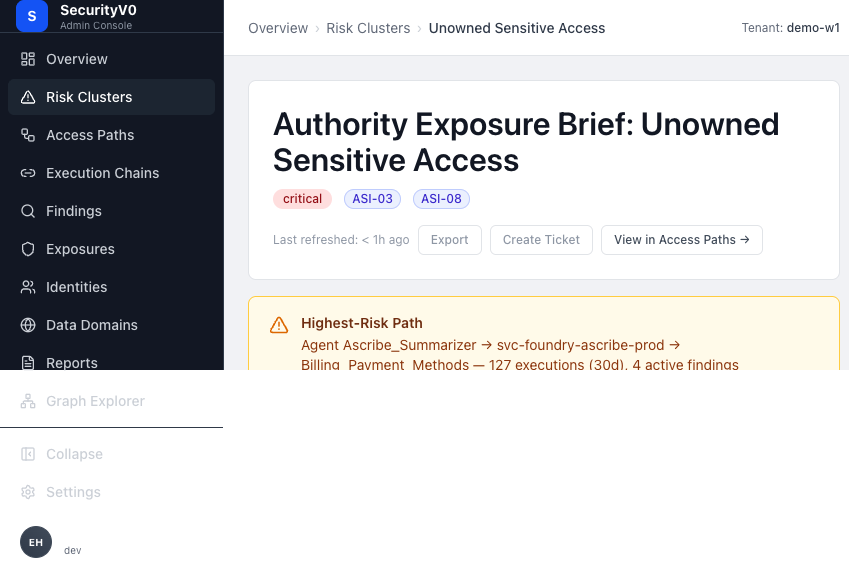 SecurityV0 cluster detail: "Authority Exposure Brief: Unowned Sensitive Access" with severity badges, governance conditions (all failing), highest-risk path callout, and remediation recommendations.
Risk Cluster detail (/clusters/:key):
- "What Happened?" narrative, "Am I Exposed?" metrics grid, Governance Checklist, Exposure Narrative, Compliance Mapping, Remediation Targets, Findings Timing Grid, Paths Detail.
Visual Comparison
| Dimension | Wiz | SecurityV0 |
|---|---|---|
| Headline metric | Wiz Security Score (single number + trend) | No single posture score |
| Trend indicators | Trend lines on score, MTTR, compliance | Delta badges on scan metrics only |
| Risk summary | Severity-bucketed issue counts, KPI cards | Business metrics cards (domains, owners, egress) |
| Compliance view | Color-coded heatmap across 250+ frameworks | Compliance mapping in cluster detail only |
| Drill-down | Dashboard → list → detail → graph (consistent hierarchy) | Overview → clusters or findings (parallel paths, less hierarchical) |
| Posture grouping | Posture Issues (findings grouped by domain) | Risk Clusters (paths grouped by finding pattern) |
| Historical trend | Multi-metric trend charts | Limited to delta badges |
Patterns to Borrow
-
Trend lines, not just delta badges — Show how metrics are changing over time, not just "+3 since last scan." A simple sparkline next to each metric card would communicate trajectory. This is the difference between "we have 5 critical findings" and "critical findings are trending down from 12 to 5 over 30 days."
-
Drill-down hierarchy consistency — Wiz's overview → list → detail → graph flow is consistent and predictable. Our Overview page jumps to either clusters or findings without a clear information hierarchy. Consider making the drill-down path more linear.
-
Posture summary for executives — Our Overview tells a detailed operational story but lacks a single "how are we doing?" indicator that an executive can absorb in 3 seconds. Consider a simple posture indicator (not a probabilistic score — a deterministic summary like "3 critical paths, 2 unowned, 1 with drift").
Patterns to Avoid
-
Aggregate probabilistic score — Wiz Security Score is a customizable composite. Our product's value is deterministic truth; a composite score would mask specificity and invite gaming. Instead, use deterministic counts ("0 unreviewed critical paths" is more trustworthy than "Score: 87/100").
-
Achievement badges / gamification — Wiz uses "Zero Criticals Club" milestones. This suits a tool used by hundreds of engineers. Our product is for accountable review by security teams; gamification would undermine gravitas.
-
250+ compliance framework heatmap — Our current compliance mapping in cluster details is more targeted and honest. We should expand it only where we can make genuine, defensible claims.
4. Resource/Entity Detail — Blast Radius
How Wiz Does It
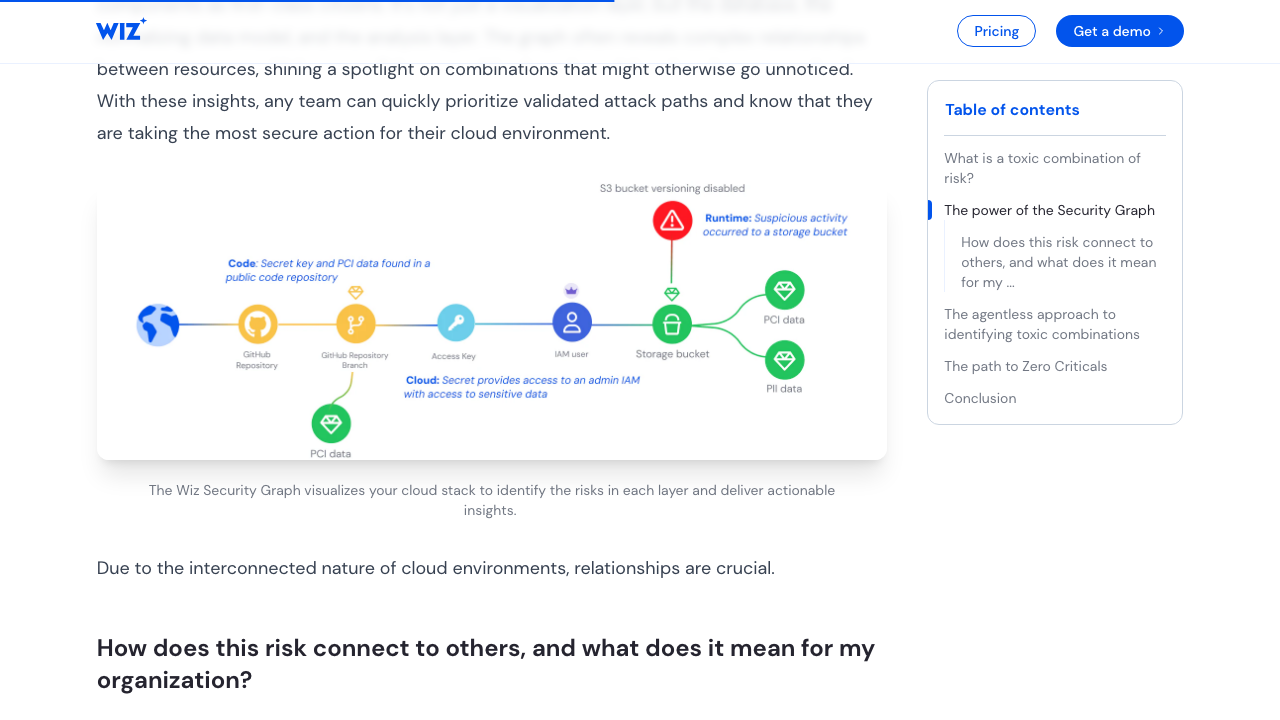 Wiz Security Graph visualization showing how multiple risk factors connect across cloud resources. The graph identifies "toxic combinations" — individually low-severity issues that chain together into critical attack paths. Each colored node represents a different risk domain (vulnerabilities, misconfigurations, exposed secrets, identity issues, data exposure, network paths). Source: Wiz Toxic Combinations blog
Security Graph architecture:
Wiz's Security Graph runs on Amazon Neptune (graph database) with ~100 billion relationships. It is simultaneously the data model, analysis engine, and visualization layer.
Node types: VMs, containers, databases, storage, identities, IAM roles, service accounts, network elements, AI components, code repos, CI/CD pipelines.
Edge types: PROTECTS, ATTACHED_TO, HAS_PUBLIC_IP, ACCESS, ASSIGNED_ROLE, ALLOWS_ACCESS_TO, permission flows, data flows, network exposure.
Blast radius visualization:
- Starting from a compromised resource, the graph traverses outward to show everything reachable.
- Shows lateral movement paths, cross-account reach, data exposure.
- Three-panel investigation: initial vulnerability → privilege escalation paths → cross-subscription identity paths.
Attack path visualization:
- Directed chain from entry point through intermediate nodes to target.
- Each node is a concrete resource with a specific vulnerability or misconfiguration.
- Scored by: public exposure, privilege level, data sensitivity, threat intelligence, runtime state.
- Cross-cloud and cross-account paths supported.
Resource detail pages use multi-tab layout:
- Overview tab — Policies, users, account association.
- Forensics tab — Checks, impact analysis, data accessibility.
- Identity tab — Access level, path (direct vs. inherited), risk indicators.
- Effective permissions — What the role can actually reach, including SCP effects.
Sources:
- Wiz Security Graph landing page
- AWS Neptune case study
- Attack path analysis (Wiz Academy)
- Wiz Security Graph for Cloud IR
How SecurityV0 Does It Currently
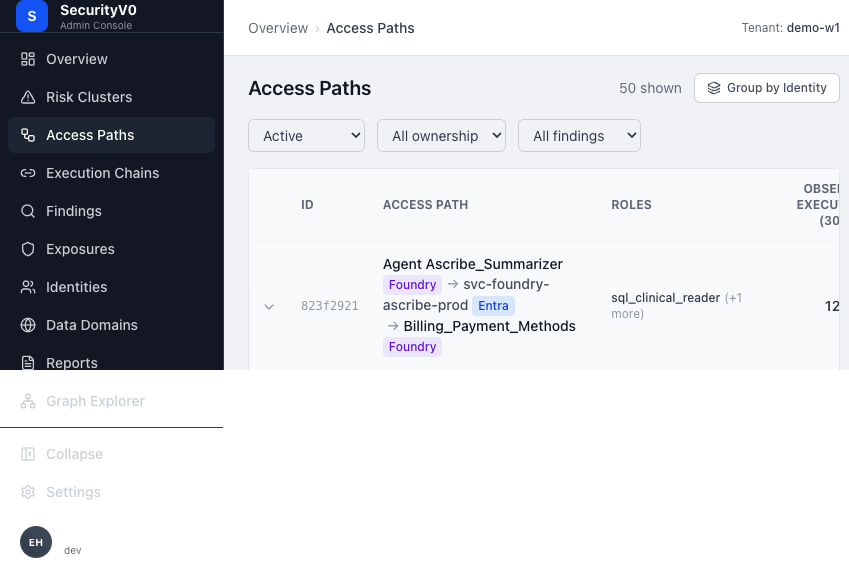
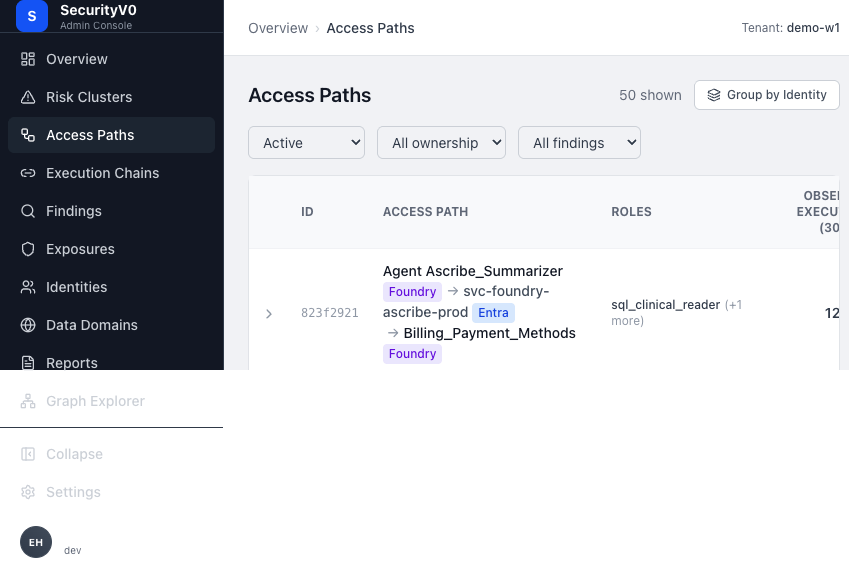 SecurityV0 access paths flat view: table with path chains (workload → identity → destination), roles, execution counts, and filter dropdowns.
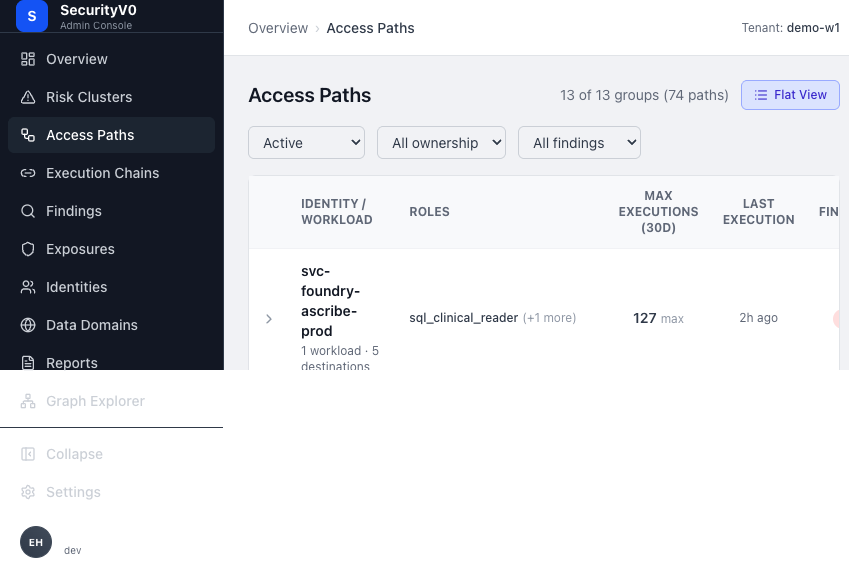 SecurityV0 access paths grouped view: 13 identity groups across 74 paths, showing identity surfaces with aggregate metrics (max executions, total findings, ownership status).
Access Path detail (/authority-paths/:id):
 SecurityV0 access path detail (inline expansion): showing via roles (sql_clinical_reader, sql_admin_reader), source system (Entra), finding types (scope drift, orphaned ownership, reachable sensitive domain, llm egress), and identity summary.
- PathHeader — Workload → Identity → Destination diagram with entity links.
- Risk Conditions Strip — Finding tiles with finding type, severity, status, evidence completeness; inline drift breakdowns; compact runtime metrics.
- Remediation Guidance — Structured actions with "Track Mitigation" button.
- Tracked Actions — Table of mitigation actions with status tracking.
- Ownership Section — Who owns the path.
- Identity Binding Card — How the identity is bound.
- Autonomous Execution Model — Frequency, last execution, pattern.
- Standing Authority Panel — Alternative execution paths via cross-system escalation.
- Related Findings — Links back to findings.
Graph Explorer (/graph):
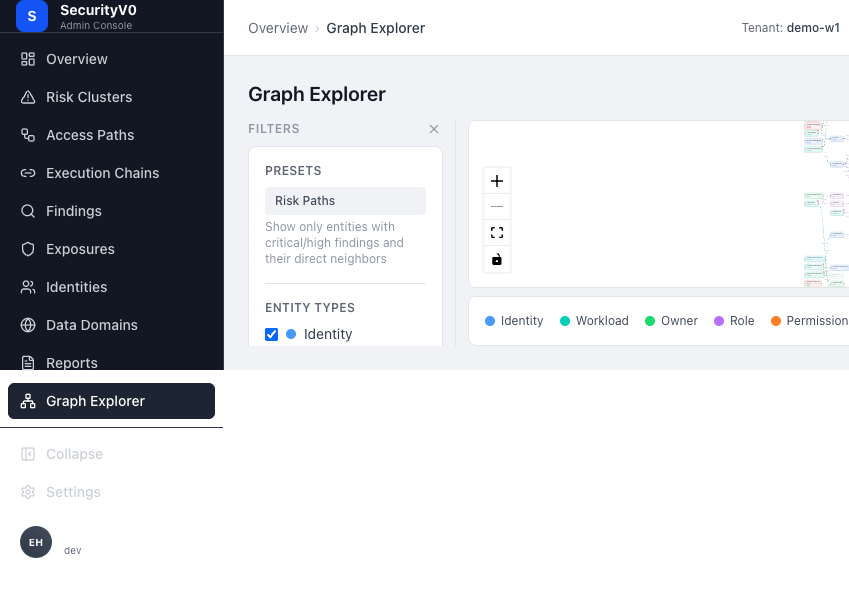 SecurityV0 graph explorer: interactive force-directed graph with entity type filters (Identity, Workload, Owner, Role, Permission, Resource), Risk Paths preset, and color-coded legend.
- Browse mode (all entities, 200 limit) and Focus mode (neighborhood subgraph).
- Sidebar filters: entity type checkboxes, "has findings only," "risk paths only," relationship type, source system.
- @xyflow/React visualization with ELK.js layout.
- Node details drawer: entity properties, relationships, finding count.
Visual Comparison
| Dimension | Wiz | SecurityV0 |
|---|---|---|
| Graph as centerpiece | Graph is embedded in every finding detail page | Graph is a separate dedicated page (/graph) |
| Blast radius | Computed and visualized from any finding | Not explicitly shown — user must navigate to graph and explore |
| Path visualization | Directed chain: entry → intermediates → target | PathHeader: Workload → Identity → Destination (simpler, deterministic) |
| Multi-tab entity detail | Overview, Forensics, Identity, Permissions tabs | Single-page vertical scroll with collapsible sections |
| Scope of graph | 100B+ relationships across all cloud resources | Entity relationships within our NHI/workload model |
| Runtime validation | eBPF sensor validates exploitability | Execution evidence with confidence badge |
Patterns to Borrow
-
Inline path visualization on finding detail — When a finding is about a specific access path, show the path diagram (workload → identity → destination) directly on the finding detail page. Our PathHeader component already exists; reuse it in finding context.
-
"What can this reach?" summary — On the access path detail, add a concise "blast radius" summary: how many sensitive domains, how many downstream systems, what data classifications are reachable. Currently this requires inspecting the graph manually.
-
Tabbed entity detail — Consider tabs instead of vertical scroll for access path detail. The page has 8+ sections; tabs would let users jump to what they need (Risk Conditions | Remediation | Ownership | Execution | Evidence).
Patterns to Avoid
-
Graph-first architecture — Wiz built everything on the graph; it is the product. Our product model is access-path-centric with deterministic evaluation. The graph is a supporting exploration tool, not the organizing principle. Promoting it to centerpiece would dilute our focused NHI governance value proposition.
-
100B-relationship cross-cloud graph — Our graph scope is intentionally narrower (NHI workloads, identities, permissions, resources). Expanding to match Wiz's scope would require a fundamentally different data pipeline and would move us away from the wedge.
5. Remediation & Action Routing
How Wiz Does It
Ticket creation:
- Inline from issue detail — 1-click, pre-populated with: description, severity, resource name/type/cloud platform, cloud provider URL, subscription, region, link to investigate in Wiz, source rule.
- 14 ticketing integrations — Jira, ServiceNow (ITSM, VR, CC), PagerDuty, Zendesk, Slack, Microsoft Teams, and more.
- Bi-directional sync — Status changes in Jira/ServiceNow reflect back in Wiz and vice versa.
Automation Rules engine (5 parameters):
| Parameter | Purpose |
|---|---|
| Filter | Which issues trigger the rule |
| Trigger Type | When the rule fires (created, status change) |
| Scope | Resources/projects the rule applies to |
| Integration | Where the notification goes |
| Body | Customizable message template |
Wiz Workflows (March 2026, Public Preview):
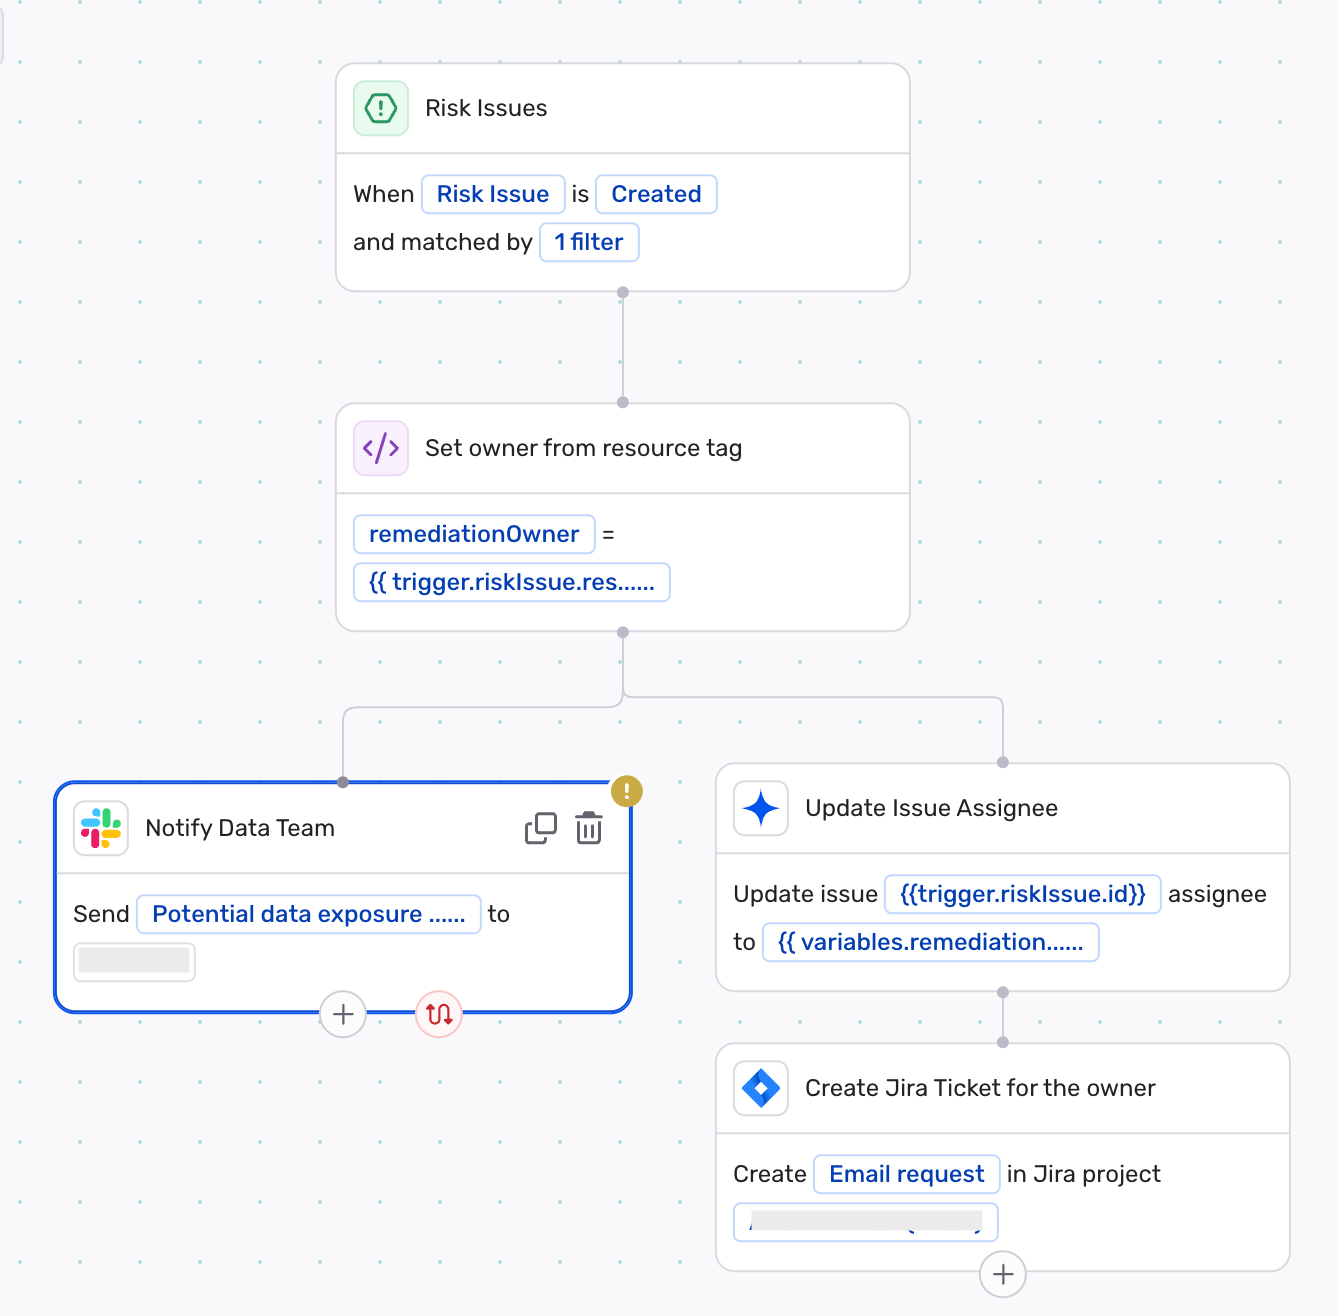 Wiz Workflows drag-and-drop builder: trigger on "Risk Issue Created" with filter, then branch into parallel steps — "Notify Data Team" via Slack, "Update Issue Assignee," and "Create Jira Ticket for the owner." Uses template variables from the trigger context. Source: Wiz Workflows blog
- Drag-and-drop workflow builder chaining triggers, conditional logic, approvals, notifications, rescans, and remediation.
- Three patterns: deterministic multi-step, human-in-the-loop, agent-led for low-risk.
Action routing strategy:
- Project-based RBAC scoping — each team sees only their risks.
- Code-to-cloud ownership — resource tags, Service Catalog, CMDB data auto-identify owners.
- Per-team automation profiles with customized severity and channel routing.
Bulk remediation:
- Patch recommendations aggregate fixes per resource.
- Base image grouping resolves vulnerabilities across all derived containers.
- Response Actions Catalog for managing auto-remediation functions.
Sources:
How SecurityV0 Does It Currently
Remediation on access path detail (/authority-paths/:id):
- Remediation Guidance Section — Structured actions (role assignment, permission removal, etc.).
- "Track Mitigation" button — Opens modal to record action progress.
- Tracked Actions table — Shows mitigation actions with status (not_started/in_progress/complete) and version history.
- Ticket Modal — Copy-to-clipboard button for creating tickets with pre-formatted content.
Ownership:
- Ownership Section on access path detail — simplified 2-row layout showing who owns the path.
- OwnershipBadge on access paths list — visible on each row.
Visual Comparison
| Dimension | Wiz | SecurityV0 |
|---|---|---|
| Ticket creation | 1-click inline, pre-populated, 14 integrations, bi-directional sync | Copy-to-clipboard ticket content, manual paste into ticketing system |
| Routing | Automated rules + project-based RBAC + code-to-cloud ownership | Ownership badge on paths, manual routing |
| Remediation format | Multi-format (CLI, Terraform, K8s, console steps) | Structured action descriptions |
| Tracking | Bi-directional Jira/ServiceNow sync | Internal tracked actions table |
| Bulk actions | Automation rules, patch aggregation, base image grouping | None currently |
| Ownership resolution | Auto-resolved from tags, Service Catalog, CMDB | Displayed from connector data, manual assignment |
Patterns to Borrow
-
Pre-populated ticket creation with integration — The copy-to-clipboard approach is a good start but adds friction. Even before building full Jira/ServiceNow integration, we can improve by generating richer pre-formatted content (markdown with severity, path details, remediation steps, and a deep link back to the path detail page). Relates to GitHub issue #221.
-
Ownership visibility at list level — Our OwnershipBadge on the access paths list is good. Extend to the findings list: show who owns the affected access path on each finding row.
-
Remediation status visible on list views — Show whether remediation has been started/tracked for a finding, visible on the list page. Currently this is buried in the access path detail's Tracked Actions section.
Patterns to Avoid
-
Auto-remediation / Response Actions — Wiz offers one-click fixes (block public S3, patch workloads). SecurityV0 is a review-and-action system; auto-remediation would bypass the accountable review that is our product's value. The human-in-the-loop is a feature, not a limitation.
-
Drag-and-drop workflow builder — Wiz Workflows is a powerful automation platform. Building our own would be massive scope creep. Our value is in the quality of the review and the clarity of the action, not in automation orchestration.
6. Filters, Search & Navigation
How Wiz Does It
Filter bar: Horizontal bar at the top of table views (not a sidebar). Supports:
- Multi-select dropdowns per column.
- Cell-value-based quick filtering (click a value to filter by it).
- Customizable column display (show/hide columns).
- Key dimensions: severity, status, projects, control_id, framework_category, resolution_reason, created_at, due_at.
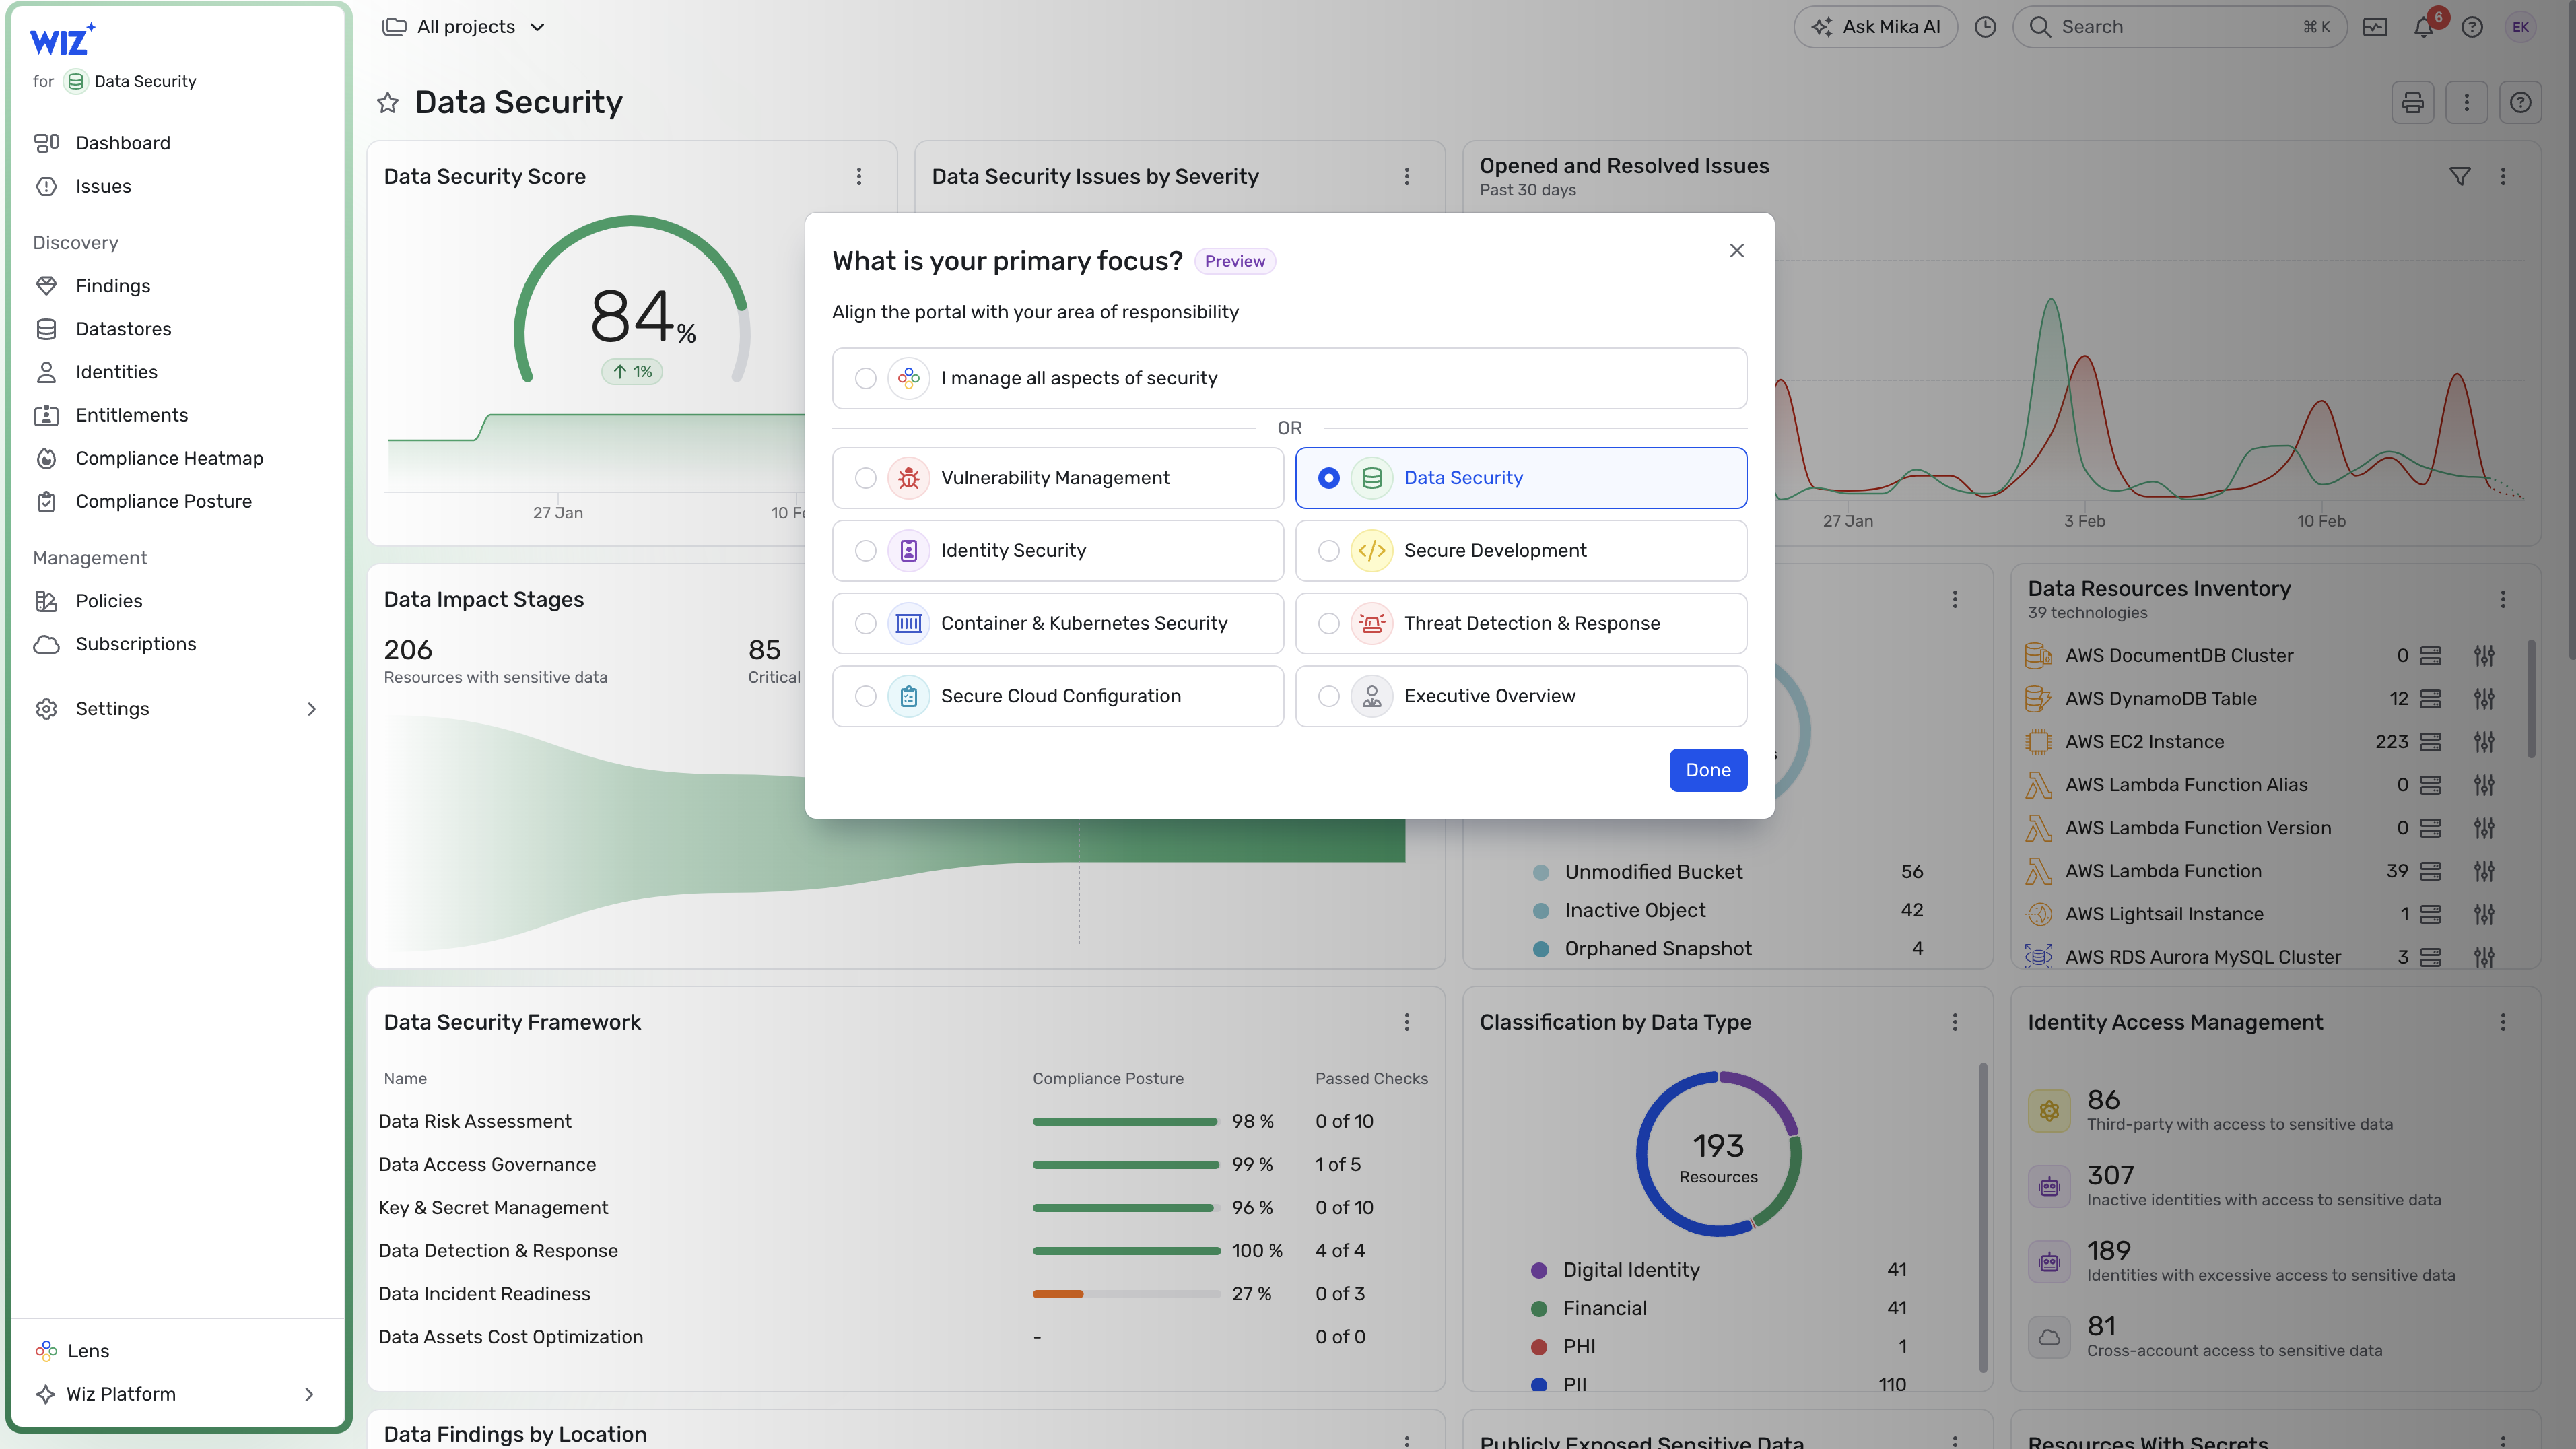 Wiz Lens role selector overlaying the Data Security dashboard: users choose their primary focus (Vulnerability Management, Identity Security, Data Security, Secure Development, Container & Kubernetes Security, Secure Cloud Configuration, Threat Detection & Response, Executive Overview). The underlying dashboard shows Data Security Score (84%), issues by severity, data import stages, classification by data type, and identity access management. Source: Wiz Lens blog
Saved views (Wiz Lens): Four built-in role-based presets:
| Lens | Audience | Focus |
|---|---|---|
| Executive Overview | CISOs, security leaders | Trending risks, team performance, KPIs |
| Data Security | Data/privacy teams | Sensitive data, access governance |
| Security Development | AppSec teams | Code security, exploitable risks |
| Security Operations | SecOps analysts | Active threats, investigations |
Search: Three mechanisms:
- AskAI (natural language) — "Show me all VMs with unpatched vulnerabilities" → converts to structured query via Claude 3.5 Sonnet + RAG.
- Wiz Query Language — Structured JSON for graph traversal with a visual query editor.
- GraphQL API Explorer — For programmatic access.
Navigation: Left sidebar with sections. Tabbed entity detail pages. Single-click cross-linking between related entities.
Sources:
How SecurityV0 Does It Currently
The screenshots below show our current filter and navigation patterns across findings and access paths:
Findings filter bar: multi-select dropdowns (severity, type, status, source) plus clickable severity pills and finding type tags as quick filters.
Access paths grouped view showing the flat/grouped toggle, filter dropdowns (status, ownership, findings), and identity surface grouping.
Filter bar: DataTableFilters component — multi-select for severity, finding_type, status, source.
Access paths list views:
- Flat view — Table with expandable rows: Workload, Identity, Destination, Ownership, Status, Findings count, Execution 30d, Confidence, Last Execution, Actions.
- Grouped view — IdentityAccessSurface groups (workload → identity) with nested paths.
- Cluster filter banner — When filtering by cluster, shows cluster context with path/execution/owner counts.
Navigation: Left sidebar (Overview, Clusters, Authority Paths, Findings, Reports, Graph, Entities). Breadcrumb context with overrides.
Search: No global search. No natural language query.
Patterns to Borrow
-
Cell-value quick filtering — Click a severity badge, finding type, or source value to instantly filter the list to that value. Low implementation cost, high usability impact.
-
Role-based presets (simplified) — Not four Wiz Lens modes, but consider 2-3 saved filter presets: "Critical & Unowned," "New This Week," "Needs Remediation." These address the most common analyst workflows without building a full preset system.
-
Grouped-by-default on the findings list — Our access paths list already has flat vs. grouped toggle. Consider offering grouping on the findings page too (group by access path, group by finding type, group by workload).
Patterns to Avoid
-
Natural language search — Wiz's AskAI is powered by a large RAG pipeline and LLM. Building this is a major investment and would introduce probabilistic results into a deterministic product. Not appropriate for our wedge.
-
JSON query language — Our data model is simpler than Wiz's 100B-relationship graph. Standard filter dropdowns serve our current complexity well.
Consolidated Recommendations
Top 5 Patterns to Borrow
| # | Pattern | Where Wiz Uses It | Where to Apply in SV0 | Impact |
|---|---|---|---|---|
| 1 | Evidence confidence as a first-class badge | Confidence scores on AI verdicts and investigation results | Finding detail header + findings list (badge next to severity) | Directly addresses Sergey's "proven vs. inferred" mandate. Relates to #219. |
| 2 | Full description visibility on list views | Issues list shows full short descriptions inline | Findings list: remove 2-line clamp, show 4-5 lines or full text | Eliminates the most common unnecessary click. |
| 3 | Smart default sort + pre-filtered views | Default to OPEN + CRITICAL, severity-descending | Findings list: default filter to active + severity sort; add 2-3 preset filter buttons | Users see what matters first without manual filtering. |
| 4 | Ownership + tracking status on list views | Project/team attribution and ticket status visible on issue rows | Findings list: add ownership column; Access paths list: add tracked action status indicator | Addresses "ownership buried in detail views" problem. Relates to #221. |
| 5 | Trend lines on dashboard metrics | Sparklines on Security Score, MTTR, compliance percentage | Overview page: add sparklines to business metrics cards and scan metrics | Communicates trajectory, not just current state. |
Top 3 Patterns to Avoid
| # | Pattern | Why Wiz Uses It | Why It Doesn't Fit SV0 |
|---|---|---|---|
| 1 | Probabilistic risk scoring / composite security score | Wiz correlates CVSS with exposure, blast radius, and runtime to produce contextual severity. Useful when scanning millions of cloud resources for unknown threats. | SV0 is deterministic review-and-action. Findings are proven truths, not probabilistic assessments. A composite score would mask specificity, invite gaming, and undermine the "what is proven vs. inferred" trust model. Use deterministic counts instead. |
| 2 | Auto-remediation / one-click fix | Wiz's scale (thousands of misconfigurations per account) requires automation. Their Response Actions Catalog and Green Agent enable bulk fixes at cloud scale. | SV0's value is accountable human review. Auto-remediation bypasses the review loop that is our product's moat. The human-in-the-loop is a feature: security teams approve actions, not robots. |
| 3 | AI-powered investigation verdicts | Wiz uses LLM-generated verdicts (Remediate/Ignore with confidence) to help analysts triage thousands of alerts. Essential at their alert volume. | SV0 findings are already deterministic conclusions from evaluators. Adding AI verdicts would create a second, less trustworthy layer of judgment on top of proven facts. Focus instead on making the deterministic evidence and confidence more visible. |
Screens to Revisit First (Priority Order)
-
Findings list (
/findings) — Add evidence confidence badges, remove description truncation, default to severity-descending + active filter, add ownership column. Estimated impact: Addresses 3 of 5 confirmed UX problems (truncation, too many clicks, confidence not visible). Relates to #219, #221. -
Finding detail (
/findings/:id) — Move evidence completeness to header badge, add inline path visualization for path-related findings, add copy-pasteable remediation commands. Estimated impact: Addresses "too many clicks to how do I fix it?" and "evidence confidence not visible" problems. -
Overview dashboard (
/) — Add sparkline trend indicators to metric cards, add a simple deterministic posture summary (e.g., "3 critical paths unreviewed, 2 owners departed, 1 new drift event"). Estimated impact: Gives executives a 3-second read on posture direction. -
Access paths list (
/authority-paths) — Add tracked action status indicator per row, enhance cluster filter banner with trend context. Estimated impact: Makes remediation progress visible without clicking into each path. -
Risk cluster detail (
/clusters/:key) — The narrative and governance checklist are strong. Consider adding a simplified "blast radius" count (total sensitive domains reachable across all paths in the cluster). Estimated impact: Helps clusters "tell a story" instead of showing raw metric cards.
Appendix: Screenshot Sources
Wiz Public Sources
SecurityV0 Screenshots
All screenshots captured from the live dev environment at http://localhost:8080 with tenant demo-w1 on 2026-03-29.
| Screenshot | Page | Key Elements Visible |
|---|---|---|
sv0-overview.png | Overview (/) | Drift activity banner, 3 business metrics cards, top risks, scan metrics |
sv0-findings-list.png | Findings (/findings) | Severity summary strip, filter bar, table with 51 results |
sv0-finding-detail.png | Finding Detail (/findings/:id) | Finding type, severity badge, deterministic explanation, evidence |
sv0-clusters-list.png | Risk Clusters (/clusters) | 7 cluster cards with severity badges and narratives |
sv0-cluster-detail.png | Cluster Detail (/clusters/:key) | Exposure brief, governance conditions, highest-risk path |
sv0-access-paths-flat.png | Access Paths flat (/authority-paths) | 50 paths, path chains, roles, execution counts |
sv0-access-paths-grouped.png | Access Paths grouped (/authority-paths) | 13 identity groups, aggregate metrics |
sv0-access-path-detail.png | Access Path Detail (inline) | Roles, source system, finding types, identity summary |
sv0-graph-explorer.png | Graph Explorer (/graph) | Force-directed graph, entity type filters, Risk Paths preset |
Next Action
Status: draft
Decision needed from: Ivan (CTO) and Sergey (CEO)
Options:
- Adopt top-5 patterns — Create GitHub issues for each recommended change (findings list improvements, evidence confidence badges, trend sparklines, ownership on list views, remediation copy-paste)
- Prioritize findings list only — Focus on the highest-impact screen first (findings list changes: description visibility, smart defaults, evidence confidence badge)
- Defer until post-sprint — Use this research to inform the next sprint planning cycle without immediate action
GitHub Issue: #217 (this research), relates to #219 (evidence confidence UI) and #221 (ownership assignment UI)